
中国城市知识合作网络结构及其多维邻近性机制——基于论文合作规模和质量的对比分析
|
孙澍(1986-),男,辽宁锦州人,博士研究生,助理研究员,主要研究方向为区域经济与区域创新网络。E-mail: sunshu@gduf.edu.cn |
收稿日期: 2023-10-15
录用日期: 2024-02-07
网络出版日期: 2024-06-06
基金资助
国家自然科学基金项目(71974182)
国家自然科学基金项目(72374191)
The structure of knowledge cooperation network in China's cities and its multidimensional proximity mechanism: Comparative analysis based on the scale and quality of paper collaboration
Received date: 2023-10-15
Accepted date: 2024-02-07
Online published: 2024-06-06
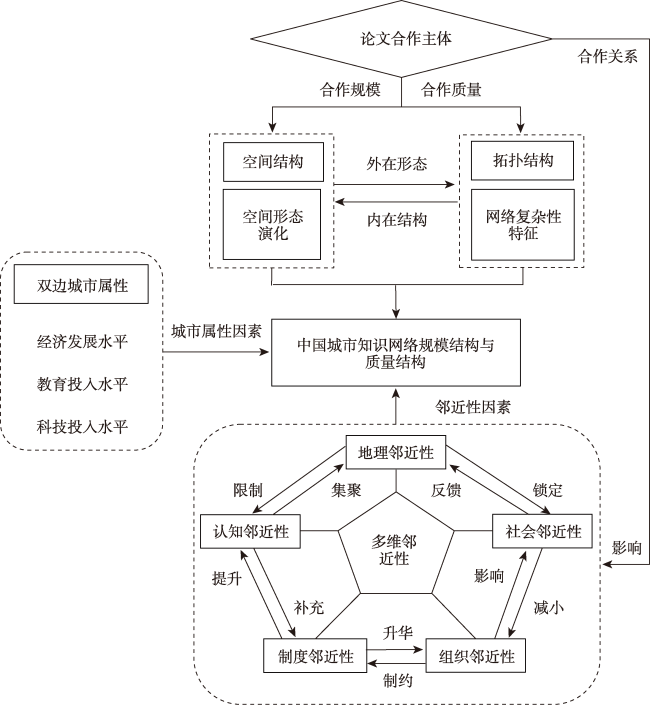
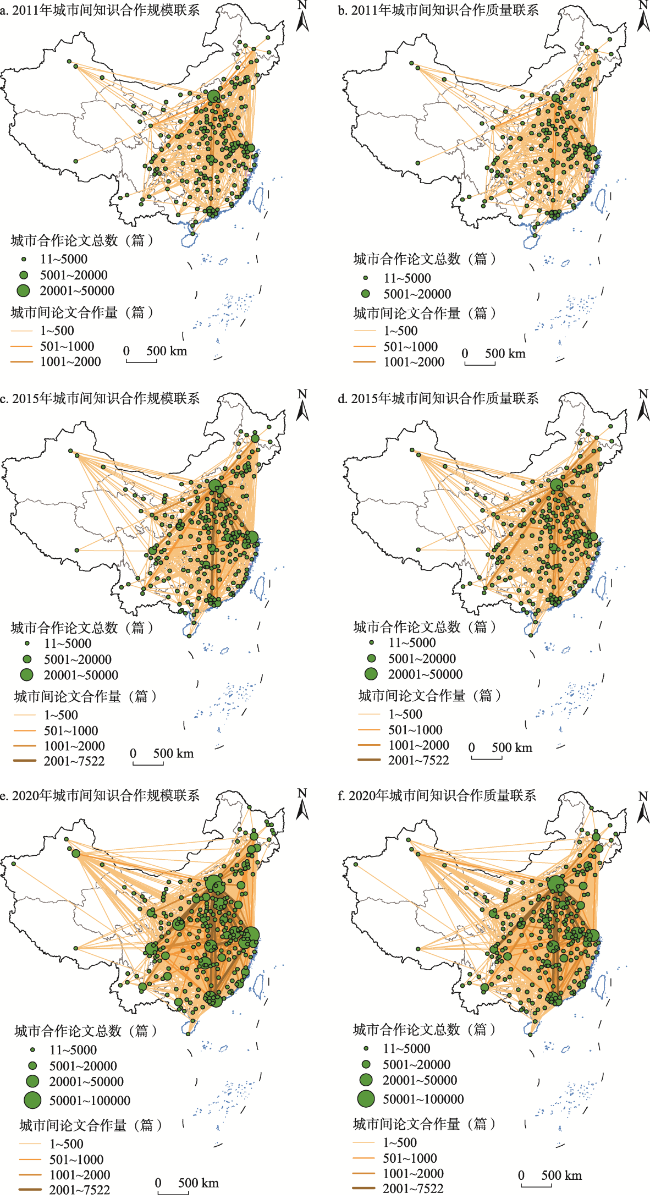
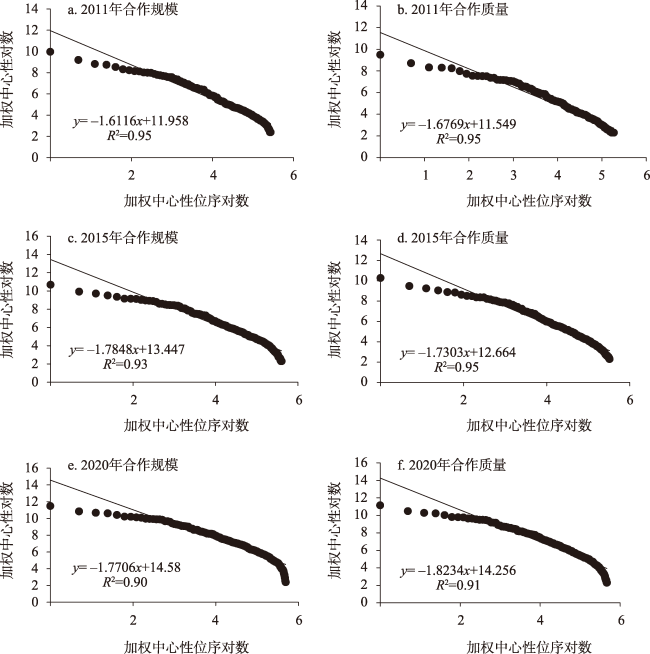
随着知识经济的发展和创新驱动发展战略的实施,知识合作网络及其多维邻近性机制已经成为政府和学界共同关注的焦点。现有研究大多关注论文合作数量,较少关注论文合作的质量。本文基于“Web of Science”中的论文合作发表数据,从论文合作规模和质量视角,构建2011—2020年中国城市知识合作网络,对其空间网络结构及拓扑演化特征进行分析,采用负二项回归模型探究其多维邻近性机制。研究结果发现:① 网络空间格局上,中国城市知识合作网络具有较为稳定的“东密西疏”的空间格局,合作规模与合作质量网络均呈现出由“轴辐扩散”结构向“菱形”空间结构转变的特征,同步呈现出以北京、上海的双核空间结构向多中心空间结构转变的趋势。城市知识合作质量网络结构发育相对缓慢,空间结构的稳定性相对不足。② 网络拓扑结构上,中国知识合作网络的规模和密度显著增加,网络极化特征明显,网络节点均表现出明显的首位分布特征。③ 网络影响机制上,地理距离对合作规模的影响更为显著,呈现先负后正的关系,对合作质量存在负向影响;社会、制度、组织邻近对合作规模和质量均起到显著的促进作用;组织邻近性对合作质量影响更大,高能级城市间的合作更容易获得较高质量的产出。不同类型城市间的知识合作受多维邻近性因素影响具有差异性。
孙澍 , 陈刚 , 王光辉 . 中国城市知识合作网络结构及其多维邻近性机制——基于论文合作规模和质量的对比分析[J]. 地理研究, 2024 , 43(6) : 1443 -1461 . DOI: 10.11821/dlyj020230907
With the development of the knowledge economy and the implementation of innovation driven development strategies, knowledge cooperation networks and their multidimensional proximity mechanisms have become a common focus of the government and academia. Most existing research concentrates more on the number of paper collaborations than the quality. Based on the collaborative publication data of papers in “Web of Science”, from the perspective of the scale and quality of paper collaboration, this paper constructs a knowledge cooperation network for Chinese cities from 2011 to 2020, analyzes its spatial and topological structure evolution characteristics, and uses a negative binomial regression model to explore the impact process and reasons of its multidimensional proximity. The research has found that: (1) In terms of network spatial pattern, the knowledge cooperation network of China's cities has a stable spatial pattern of “dense in the east and sparse in the west”. Both the cooperation scale network and cooperation quality network structure show a characteristic of transforming from a “radial diffusion” structure to a “diamond” spatial structure. At the same time, there is a trend of transforming from a dual core spatial structure in Beijing and Shanghai to a multi-center spatial structure. The development of knowledge cooperation quality network structure in China's cities is relatively slow, and the stability of spatial structure is comparatively insufficient. (2) In terms of network topology, the scale and density of China's knowledge cooperation network are significantly increased with obvious the network polarization characteristics. Network nodes all exhibit evident primary distribution characteristics. (3) In terms of network impact mechanism, geographic distance has a more significant impact on the scale of cooperation, showing a negative first and then positive relationship, while its impact on the quality of cooperation is relatively limited; Society, system, and organizational proximity all have a significant promoting effect on the scale and quality of cooperation; Organizational proximity has a greater impact on the quality of cooperation, and cooperation among high-energy cities, and cities of the same level makes it easier to obtain high-quality outputs. The knowledge cooperation among different types of cities is influenced by multidimensional proximity factors, and this influence varies.
表1 2011—2020年高被引论文界定阈值Tab. 1 Threshold of highly cited papers from 2011 to 2020 |
| 年份 | 2011 | 2012 | 2013 | 2014 | 2015 | 2016 | 2017 | 2018 | 2019 | 2020 |
|---|---|---|---|---|---|---|---|---|---|---|
| 论文平均被引用次数 | 28.69 | 27.4 | 26.69 | 25.94 | 24.32 | 21.86 | 20.13 | 17.25 | 12.6 | 8.49 |
| 高被引界定值(取整) | 34 | 32 | 31 | 31 | 29 | 26 | 24 | 20 | 15 | 10 |
表2 2011年、2015年和2020年中国知识合作网络的拓扑属性Tab. 2 Topological properties of China's knowledge cooperation network in 2011, 2015, and 2020 |
| 类型 | 年份 | 节点 | 边 | 平均度 | 密度 | 平均路径长度 | 平均聚类系数 |
|---|---|---|---|---|---|---|---|
| 合作规模 | 2011 | 286 | 5430 | 18 | 0.067 | 2.19 | 0.36 |
| 2015 | 303 | 7886 | 26 | 0.086 | 2.09 | 0.38 | |
| 2020 | 305 | 14726 | 48 | 0.159 | 1.89 | 0.38 | |
| 合作质量 | 2011 | 274 | 3368 | 12 | 0.045 | 2.36 | 0.36 |
| 2015 | 295 | 5814 | 19 | 0.067 | 2.18 | 0.37 | |
| 2020 | 305 | 10993 | 36 | 0.119 | 1.97 | 0.38 |
表3 知识合作规模和质量负二项回归模型估计结果Tab. 3 Estimation results of negative binomial regression model for knowledge cooperation scale and quality |
| 变量属性 | 变量名称 | 模型1 | 模型2 | 模型3 | 模型4 |
|---|---|---|---|---|---|
| 地理邻近性 | GEO | -0.00667*** | -0.188*** | -0.0216*** | -0.0945*** |
| (-7.16) | (-10.32) | (-23.80) | (-5.47) | ||
| 社会邻近性 | SOC | 0.0362*** | 0.202*** | 0.0636*** | 0.149*** |
| (95.29) | (123.62) | (66.43) | (64.10) | ||
| 制度邻近性 | INS | 0.0309*** | 0.156*** | 0.0684*** | 0.114*** |
| (10.27) | (24.24) | (18.49) | (13.89) | ||
| 认知邻近性 | COG | 0.302*** | 0.187*** | 0.112*** | 0.0591*** |
| (13.92) | (8.93) | (5.68) | (2.94) | ||
| 组织邻近性 | ORG | 0.0522*** | 0.0720*** | 0.801*** | 0.804*** |
| (4.94) | (6.59) | (67.01) | (67.53) | ||
| 经济水平 | perGDP1 | 0.340*** | 0.279*** | 0.0994*** | 0.0919*** |
| (33.74) | (31.40) | (7.58) | (7.11) | ||
| perGDP2 | 0.322*** | 0.355*** | 0.0638*** | 0.0596*** | |
| (33.18) | (40.94) | (5.03) | (4.76) | ||
| 教育支持 | edu1 | 0.558*** | 0.530*** | 0.151*** | 0.153*** |
| (60.19) | (66.56) | (14.35) | (14.73) | ||
| edu2 | 0.637*** | 0.604*** | 0.155*** | 0.154*** | |
| (71.14) | (75.46) | (14.96) | (14.96) | ||
| 科技支持 | sci1 | 0.0808*** | 0.0976*** | 0.0317*** | 0.0291*** |
| (16.03) | (22.75) | (4.72) | (4.42) | ||
| sci2 | 0.0425*** | 0.0414*** | 0.0554*** | 0.0512*** | |
| (8.80) | (9.89) | (8.71) | (8.16) | ||
| 地理邻近性二次项 | GEO2 | 0.000713*** | 0.000289*** | ||
| (10.56) | (4.51) | ||||
| 社会邻近性二次项 | SOC2 | -0.00410*** | -0.00279*** | ||
| (-65.65) | (-30.43) | ||||
| 制度邻近性二次项 | INS2 | 0.0236*** | 0.0106*** | ||
| (21.75) | (7.76) | ||||
| 常数项 | _cons | -22.49*** | -10.01*** | -4.623*** | 0.0549 |
| (-122.43) | (-8.08) | (-20.92) | (0.05) | ||
| N | 80485 | 80485 | 73558 | 73558 |
注:***表示1%的显著性水平,( )内为T统计量。 |
表4 知识合作规模异质性分析Tab. 4 Heterogeneity analysis of knowledge cooperation scale |
| 变量属性 | 变量名称 | 低能级-低能级 | 低能级-高能级 | 高能级-高能级 |
|---|---|---|---|---|
| 地理邻近性 | GEO | -0.00413*** | -0.0122*** | 0.00964*** |
| (-3.59) | (-8.68) | (2.91) | ||
| 社会邻近性 | SOC | 0.113*** | 0.0307*** | 0.0369*** |
| (79.90) | (61.71) | (34.21) | ||
| 制度邻近性 | INS | 0.0504*** | 0.0397*** | 0.111*** |
| (8.46) | (10.38) | (4.55) | ||
| 认知邻近性 | COG | 0.203*** | 0.314*** | 0.251*** |
| (8.19) | (9.03) | (3.03) | ||
| 经济水平 | perGDP1 | 0.320*** | 0.332*** | 0.413*** |
| (19.31) | (22.20) | (16.36) | ||
| perGDP2 | 0.345*** | 0.266*** | 0.421*** | |
| (20.94) | (18.59) | (16.83) | ||
| 教育支持 | edu1 | 0.436*** | 0.573*** | 0.493*** |
| (28.29) | (42.34) | (21.56) | ||
| edu2 | 0.515*** | 0.675*** | 0.552*** | |
| (32.74) | (52.10) | (25.78) | ||
| 科技支持 | sci1 | 0.00200 | 0.0839*** | 0.144*** |
| (0.24) | (11.21) | (12.22) | ||
| sci2 | 0.0000977 | 0.0504*** | 0.0788*** | |
| (0.01) | (7.35) | (6.90) | ||
| 常数项 | _cons | -17.05*** | -21.87*** | -26.20*** |
| (-55.11) | (-74.50) | (-46.74) | ||
| N | 30066 | 44550 | 5869 |
注:***表示1%的显著性水平,( )内为T统计量。此处将城市能级作为分组依据进行异质性分析,因此组织邻近性指标不再纳入回归模型。 |
表5 知识合作质量异质性分析Tab. 5 Heterogeneity analysis of knowledge cooperation quality |
| 变量属性 | 变量名称 | 低能级-低能级 | 低能级-高能级 | 高能级-高能级 |
|---|---|---|---|---|
| 地理邻近性 | GEO | -0.00663*** | -0.0300*** | -0.0889*** |
| (-4.77) | (-24.04) | (-15.06) | ||
| 社会邻近性 | SOC | 0.0492*** | 0.0832*** | 0.0323*** |
| (26.64) | (46.14) | (17.70) | ||
| 制度邻近性 | INS | 0.0343*** | 0.0266*** | 0.120*** |
| (4.24) | (6.10) | (6.15) | ||
| 认知邻近性 | COG | 0.0706** | 0.216*** | -0.616*** |
| (2.47) | (7.70) | (-4.48) | ||
| 经济水平 | perGDP1 | 0.126*** | 0.123*** | -0.0493 |
| (5.56) | (6.91) | (-1.55) | ||
| perGDP2 | 0.159*** | 0.0678*** | -0.146 | |
| (7.00) | (4.04) | (-4.77) | ||
| 教育支持 | edu1 | 0.202*** | 0.151*** | 0.0839*** |
| (9.94) | (10.88) | (3.41) | ||
| edu2 | 0.166*** | 0.198*** | 0.234*** | |
| (8.08) | (14.50) | (9.64) | ||
| 科技支持 | sci1 | -0.0185 | 0.0756*** | 0.0134 |
| (-1.56) | (8.29) | (1.04) | ||
| sci2 | 0.0150 | 0.0729*** | 0.0235* | |
| (1.27) | (8.67) | (1.89) | ||
| 常数项 | _cons | -7.662*** | -4.468*** | 12.36*** |
| (-18.80) | (-13.93) | (13.49) | ||
| N | 24526 | 43163 | 5869 |
注:*、**、***分别表示10%、5%、1%的显著性水平,( )内为T统计量。此处将城市能级作为分组依据进行异质性分析,因此组织邻近性指标不再纳入回归模型。 |
真诚感谢匿名评审专家在论文评审中所付出的时间和精力,专家对本文研究方法优化、理论框架完善、结果解读深入和政策建议合理方面给予了重要修改意见,使本文获益匪浅。
| [1] |
黄晓东, 马海涛, 苗长虹. 基于创新企业的中国城市网络联系特征. 地理学报, 2021, 76(4): 835-852.
[
|
| [2] |
曹湛, 戴靓, 吴祖泉, 等. 城市技术网络的概念框架与实证研究. 地理研究, 2023, 42(9): 2302-2323.
[
|
| [3] |
戴靓, 纪宇凡, 王嵩, 等. 中国城市知识创新网络的演化特征及其邻近性机制. 资源科学, 2022, 44(7): 1494-1505.
[
|
| [4] |
刘承良, 桂钦昌, 段德忠, 等. 全球科研论文合作网络的结构异质性及其邻近性机理. 地理学报, 2017, 72(4): 737-752.
[
|
| [5] |
张凯煌, 千庆兰, 陈清怡. 多尺度视角下中国新能源汽车产业创新空间格局及网络特征. 地理科学进展, 2021, 40(11): 1824-1838.
[
|
| [6] |
刘承良, 管明明. 基于专利转移网络视角的长三角城市群城际技术流动的时空演化. 地理研究, 2018, 37(5): 981-994.
[
|
| [7] |
唐福涛, 张冰, 王瑞文. 京津冀机构协同合作网络研究: 以三地科技进步奖获奖项目为例. 地域研究与开发, 2022, 41(3): 12-17, 37.
[
|
| [8] |
白如山, 胡森林, 庄良, 等. 基于细分行业的安徽省创新型企业集聚研究. 世界地理研究, 2020, 29(6): 1190-1201.
[
|
| [9] |
吴家权, 谢涤湘, 李超骕, 等. 知识创新与技术创新网络空间结构的演化特征: 基于“流空间”视角的粤港澳大湾区案例研究. 城市问题, 2021, (4): 12-21.
[
|
| [10] |
魏石梅, 潘竟虎. 中国地级及以上城市网络结构韧性测度. 地理学报, 2021, 76(6): 1394-1407.
[
|
| [11] |
|
| [12] |
鲜果, 曾刚, 曹贤忠. 中国城市间创新网络结构及其邻近性机理. 世界地理研究, 2018, 27(5): 136-146.
[
|
| [13] |
刘承良, 牛彩澄. 东北三省城际技术转移网络的空间演化及影响因素. 地理学报, 2019, 74(10): 2092-2107.
[
|
| [14] |
|
| [15] |
|
| [16] |
曹湛, 戴靓, 杨宇, 等. 基于“蜂鸣-管道”模型的中国城市知识合作模式及其对知识产出的影响. 地理学报, 2022, 77(4): 960-975.
[
|
| [17] |
|
| [18] |
刘权毅, 詹庆明, 刘稳, 等. 基于铁路客流的湖北省城市网络关联与空间组织结构特征. 地球信息科学学报, 2020, 22(5): 1008-1022.
[
|
| [19] |
席强敏, 李国平, 孙瑜康, 等. 京津冀科技合作网络的演变特征及影响因素. 地理学报, 2022, 77(6): 1359-1373.
[
|
| [20] |
段德忠, 金红. 中国城市绿色技术扩散的时空过程与形成机制. 地理学报, 2023, 78(8): 2001-2018.
[
|
| [21] |
周晓艳, 侯美玲, 李霄雯. 独角兽企业内部联系视角下中国城市创新网络空间结构研究. 地理科学进展, 2020, 39(10): 1667-1676.
[
|
| [22] |
柳坤, 刘毅. 创新型城市内部技术转移网络空间特征与影响因素: 以广州市为例. 地理研究, 2023, 42(9): 2324-2342.
[
|
| [23] |
杜亚楠, 王庆喜, 王忠燕. 多维邻近下中国三大城市群创新网络演化特征及机制研究. 地理科学, 2023, 43(2): 197-207.
[
|
| [24] |
周锐波, 邱奕锋, 胡耀宗. 中国城市创新网络演化特征及多维邻近性机制. 经济地理, 2021, 41(5): 1-10.
[
|
| [25] |
李迎成, 杨钰华, 马海涛. 邻近视角下长三角城市多尺度创新网络形成的微观机制. 地理学报, 2023, 78(8): 2074-2091.
[
|
| [26] |
|
| [27] |
|
| [28] |
苏屹, 郭家兴, 王文静. 多维邻近性下新能源合作创新网络演化研究. 科研管理, 2021, 42(8): 67-74.
[
|
| [29] |
覃柳婷, 滕堂伟, 张翌, 等. 中国高校知识合作网络演化特征与影响因素研究. 科技进步与对策, 2020, 37(22): 125-133.
[
|
| [30] |
韩刚, 史修松, 刘志敏. 基于ERGM模型的江苏省城市网络紧凑性形成机理研究. 地理科学进展, 2021, 40(12): 2025-2034.
[
|
| [31] |
|
| [32] |
戴靓, 曹湛, 马海涛, 等. 中国城市知识合作网络结构演化的影响机制. 地理学报, 2023, 78(2): 334-350.
[
|
| [33] |
马海涛. 知识流动空间的城市关系建构与创新网络模拟. 地理学报, 2020, 75(4): 708-721.
[
|
| [34] |
|
| [35] |
|
| [36] |
谢其军, 宋伟. 地理邻近性影响合作网络及区域创新绩效的机理研究. 管理学报, 2020, 17(7): 1016-1023.
[
|
| [37] |
丁子军, 王瑞霖, 戴靓, 等. 长三角城市技术创新网络的时空演化与影响机制. 资源开发与市场, 2023, 39(5): 573-579.
[
|
| [38] |
戴靓, 刘承良, 王嵩, 等. 长三角城市科研合作的邻近性与自组织性. 地理研究, 2022, 41(9): 2499-2515.
[
|
| [39] |
曾德明, 任浩, 戴海闻, 等. 组织邻近和组织背景对组织合作创新地理距离的影响. 管理科学, 2014, (4): 12-22.
[
|
| [40] |
刘雪立. 基于Web of Science和ESI数据库高被引论文的界定方法. 中国科技期刊研究, 2012, 23(6): 975-978.
[
|
| [41] |
|
| [42] |
陈刚, 王光辉, 郑满茵. 上市公司与客户联系视角下的中国城际网络结构时空演化研究. 地球信息科学学报, 2023, 25(1): 223-238.
[
|
| [43] |
王琳琳, 王光辉, 陈刚. 基于三螺旋理论的中国城市间产学研创新合作网络结构特征分析. 科技管理研究, 2023, 43(12): 101-110.
[
|
| [44] |
曾冰, 邱志萍. 省际交界区经济网络空间结构研究: 以湘鄂赣的灯光数据为实证. 财经科学, 2018, (11): 110-121.
[
|
| [45] |
|
| [46] |
王庆喜, 胡志学. 多维邻近下浙江城市创新网络演化及其机制研究. 地理科学, 2021, 41(8): 1380-1388.
[
|
| [47] |
|
| [48] |
|
/
| 〈 |
|
〉 |