
新冠疫情背景下服务设施关停对暴力犯罪的影响
|
龙冬平(1985-),男,湖南邵阳人,博士,讲师,硕士生导师,研究方向为公共安全与犯罪地理。E-mail: longdp@gzhu.edu.cn |
收稿日期: 2023-11-21
录用日期: 2024-04-04
网络出版日期: 2024-07-05
基金资助
国家自然科学基金项目(42271233)
国家自然科学基金项目(42001164)
国家重点研发计划项目(2018YFB0505500)
国家重点研发计划项目(2018YFB0505503)
The shutdown of services facility during COVID-19 pandemic: How it affects violent crimes
Received date: 2023-11-21
Accepted date: 2024-04-04
Online published: 2024-07-05
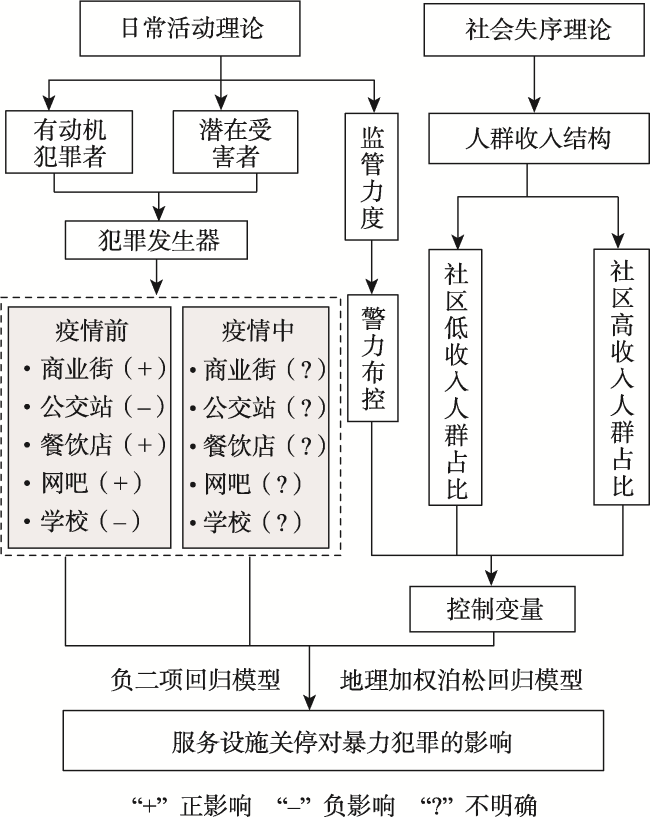
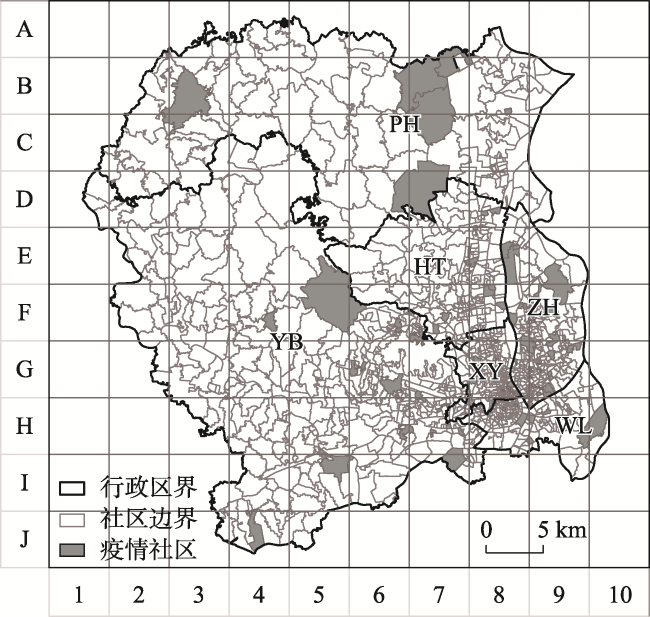
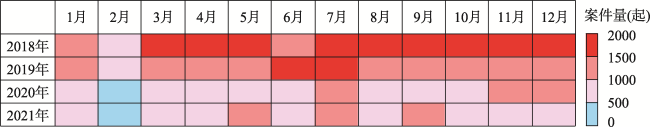
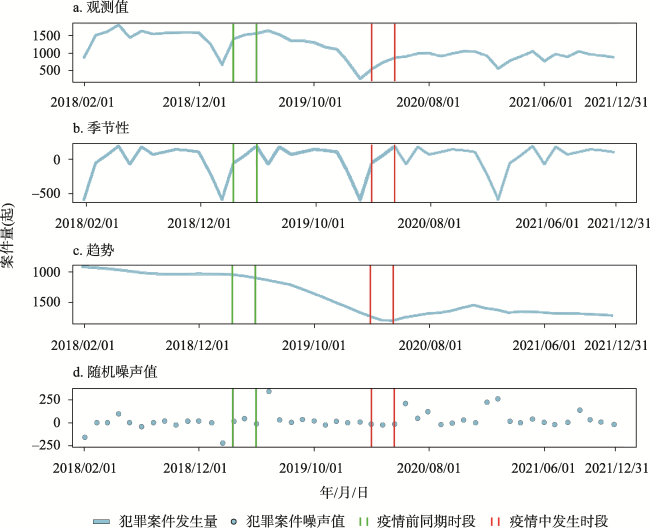
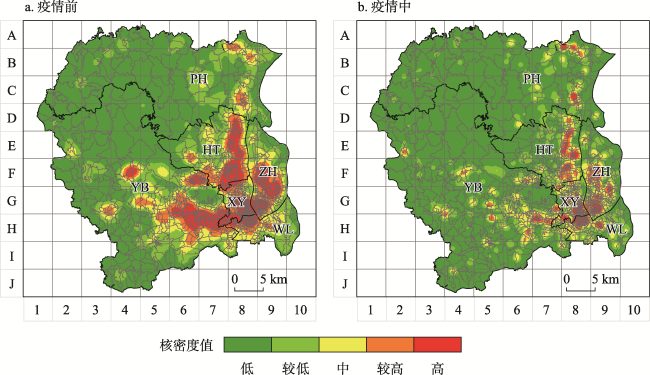
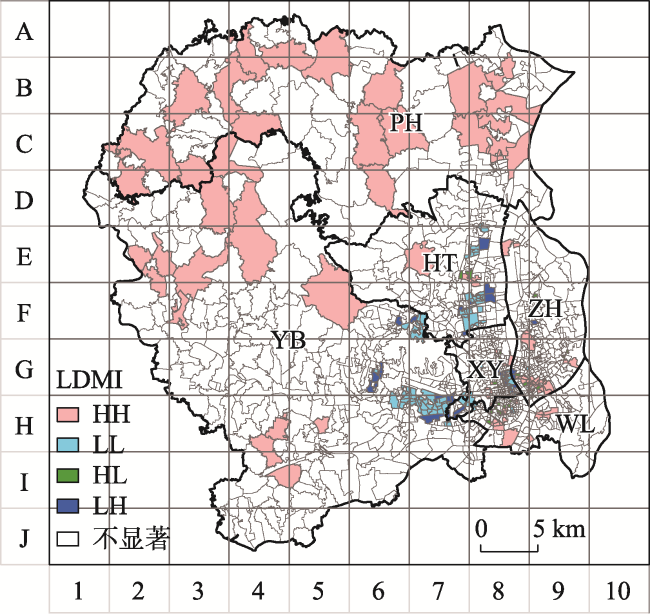
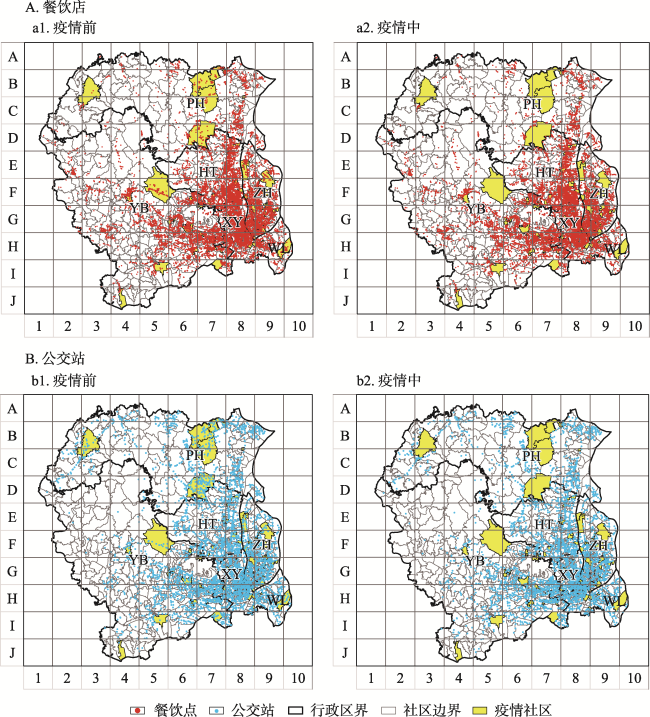
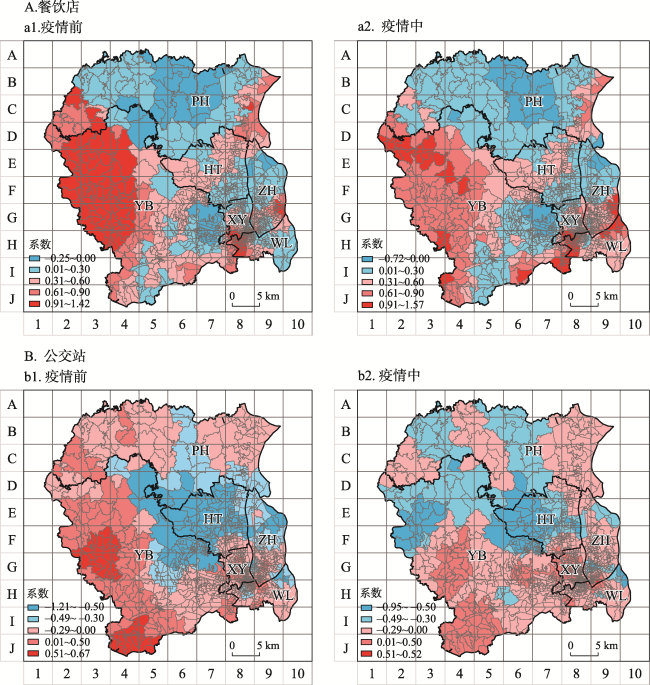
抑制犯罪的高发突发是国家社会治安的重大需求。新冠疫情防控影响了城市各类服务设施的运营状况,由此可能带来犯罪主体的日常活动变化,因此它可以看做是一场大范围的犯罪预防“自然实验”。论文以ZG市为例,利用STL时间序列分解和局部差分莫兰指数等方法,分析“疫情前”和“疫情中”ZG市暴力犯罪的时空格局及集聚变化特征;同时基于日常活动和社会失序等理论,采用负二项回归模型探究疫情防控背景下服务设施关停对暴力犯罪的影响;并结合地理加权泊松回归模型进一步分析服务设施的影响在空间上的异质作用。研究发现: ①ZG市暴力犯罪的数量总体趋向减少。即“疫情前”暴力犯罪平缓下降,而“疫情中”则急剧下降。② ZG市暴力犯罪在“疫情前”和“疫情中”均有明显的集聚特征,但这两个时期的犯罪热点发生了明显变化。“疫情前”和“疫情中”犯罪热点集中在中心城区;但与“疫情前”相比,“疫情中”犯罪热点的面积大幅减少且分散。③ 基于局部差分莫兰指数对“疫情前”和“疫情中”犯罪变化特征进行探测,发现“疫情中”ZG市中心城区变为暴力犯罪减少的区域连片,形成“低低”集聚区,而其周边区域变成暴力犯罪增加的区域连片,形成“高高”集聚区。④ 与“疫情前”相比,本文验证了“疫情中”各类服务设施对暴力犯罪的影响均有所减弱。例如,餐饮店、商业街、网吧对暴力犯罪的促进作用出现了减弱,公交站、学校对暴力犯罪的抑制作用也有所减弱。最后,进一步发现餐饮店、公交站更受新冠疫情关停政策的影响,与“疫情前”相比,“疫情中”餐饮店和公交站保持正常运营的数量和分布在空间上发生了较大变化,从而对暴力犯罪的减少产生了较大影响。
龙冬平 , 朱家辉 , 柳林 , 昌佳雨 . 新冠疫情背景下服务设施关停对暴力犯罪的影响[J]. 地理研究, 2024 , 43(7) : 1827 -1849 . DOI: 10.11821/dlyj020231041
The suppression of high-incidence crime is a crucial aspect of ensuring national social security. Additionally, the COVID-19 pandemic prevention and control measures have served as a large-scale "natural experiment" in crime prevention, which has also affected the operational status of various service facilities in cities, potentially leading to changes in the daily activities of criminals. This research tries to analyze the spatiotemporal characteristics and clustering changes of violent crimes in ZG city during the "pre-pandemic" and "in-pandemic" periods by using STL time series decomposition and local differential Moran's index methods. Meanwhile, based on theories of routine activities and social disorganization, it adopts negative binomial regression models to explore the impact of service facility shutdown under the background of epidemic prevention and control on violent crimes. Additionally, a geographically weighted Poisson regression model is used to analyze the spatial heterogeneity of the impact of service facilities. The findings are: (1) The total number of violent crimes in ZG city showed an overall downward trend. Specifically, the number of violent crimes declined slowly in the "pre-pandemic" period, while it dropped sharply during the "in-pandemic" period. (2) Violent crimes in ZG city exhibited obvious clustering characteristics in both the "pre-pandemic" and "in-pandemic" periods, but the crime hotspots changed significantly between the two periods. The hotspots were concentrated in the central urban area in both periods, but compared with the "pre-pandemic" period, the area and dispersion of hotspots increased substantially during the "in-pandemic" period. (3) Based on the local differential Moran's index, this study detected the characteristics of changes in violent crimes before and during the pandemic. The results show that during the "in-pandemic" period, the central urban area of ZG city became a contiguous region where violent crimes decreased, forming a "low-low clustering area", while its surrounding areas became contiguous regions where violent crimes increased, forming a "high-high clustering area". (4) Compared with the "pre-pandemic" period, this study has verified that the impact of various service facilities on violent crimes has been weakened during the "in-pandemic" period. For example, the promoting effects of restaurants, commercial streets, and cybercafés on violent crimes decreased, and the inhibitory effects of bus stations and schools on violent crimes also weakened. Finally, it was further found that restaurants and bus stations were more affected by the COVID-19 lockdown policies, and the number and spatial distribution of normally operating restaurants and bus stations changed substantially compared with the "pre-pandemic" period, thereby reducing violent crimes.
Key words: violent crimes; services facility; crime changes; COVID-19 pandemic; ZG city
表1 变量描述性统计Tab. 1 Descriptive statistics on the variables of this study |
| 变量 | 平均值 | 标准差 | 最小值 | 最大值 |
|---|---|---|---|---|
| 暴力犯罪(因变量) | ||||
| 疫情前 案件量(起) | 23.98 | 33.05 | 0 | 321 |
| 疫情中 案件量(起) | 14.49 | 21.68 | 0 | 246 |
| 服务设施(自变量) | ||||
| 疫情前 商业街(个) | 0.40 | 1.40 | 0 | 26 |
| 疫情中 商业街(个) | 0.37 | 1.32 | 0 | 26 |
| 疫情前 公交站(个) | 3.62 | 5.12 | 0 | 104 |
| 疫情中 公交站(个) | 3.22 | 4.06 | 0 | 33 |
| 疫情前 餐饮店(个) | 22.42 | 37.92 | 0 | 563 |
| 疫情中 餐饮店(个) | 20.49 | 37.00 | 0 | 563 |
| 疫情前 网吧(个) | 1.32 | 2.22 | 0 | 19 |
| 疫情中 网吧(个) | 1.17 | 2.05 | 0 | 19 |
| 疫情前 学校(个) | 7.59 | 16.29 | 0 | 294 |
| 疫情中 学校(个) | 6.81 | 14.08 | 0 | 292 |
| 控制变量 | ||||
| 疫情前 警力布控点(个) | 1.33 | 1.66 | 0 | 14 |
| 疫情中 警力布控点(个) | 1.24 | 1.62 | 0 | 14 |
| 社区高收入人群占比(%) | 1.51 | 0.47 | 0 | 6.33 |
| 社区低收入人群占比(%) | 17.57 | 2.91 | 7.08 | 33.59 |
| 暴露变量 | ||||
| 社区面积(km2) | 1.06 | 2.28 | 0.01 | 22.23 |
表2 “疫情前”变量的相关系数矩阵Tab. 2 Matrix of variables correlation coefficients for the "pre-pandemic" variables |
| 变量 | 商业街 | 公交站 | 餐饮店 | 网吧 | 学校 | 警力 布控点 | 社区高收入 人群占比 | 社区低收入 人群占比 |
|---|---|---|---|---|---|---|---|---|
| 商业街 | 1.000 | |||||||
| 公交站 | 0.193 | 1.000 | ||||||
| 餐饮店 | 0.288 | 0.356 | 1.000 | |||||
| 网吧 | 0.286 | 0.271 | 0.545 | 1.000 | ||||
| 学校 | 0.051 | 0.256 | 0.148 | 0.097 | 1.000 | |||
| 警力布控点 | 0.080 | 0.200 | 0.167 | 0.177 | 0.090 | 1.000 | ||
| 社区高收入人群占比 | -0.062 | -0.223 | -0.153 | -0.016 | -0.113 | -0.037 | 1.000 | |
| 社区低收入人群占比 | 0.004 | 0.097 | 0.183 | 0.007 | 0.031 | 0.011 | -0.288 | 1.000 |
表3 “疫情中”变量的相关系数矩阵Tab. 3 Matrix of variables correlation coefficients for the "in-pandemic" variables |
| 变量 | 商业街 | 公交站 | 餐饮店 | 网吧 | 学校 | 警力 布控点 | 社区高收入 人群占比 | 社区低收入 人群占比 |
|---|---|---|---|---|---|---|---|---|
| 商业街 | 1.000 | |||||||
| 公交站 | 0.238 | 1.000 | ||||||
| 餐饮店 | 0.304 | 0.367 | 1.000 | |||||
| 网吧 | 0.305 | 0.315 | 0.561 | 1.000 | ||||
| 学校 | 0.075 | 0.274 | 0.154 | 0.103 | 1.000 | |||
| 警力布控点 | 0.077 | 0.254 | 0.176 | 0.171 | 0.108 | 1.000 | ||
| 社区高收入人群占比 | -0.060 | -0.205 | -0.134 | 0.004 | -0.109 | -0.019 | 1.000 | |
| 社区低收入人群占比 | 0.010 | 0.112 | 0.171 | 0.018 | 0.045 | 0.012 | -0.288 | 1.000 |
表4 负二项回归模型结果Tab. 4 Results of the negative binomial regression model |
| 变量 | 模型1 | 模型2 | |||
|---|---|---|---|---|---|
| β | IRR | β | IRR | ||
| 服务设施(自变量) | |||||
| 商业街 | 0.125** | 1.133 | 0.111** | 1.118 | |
| 公交站 | -0.226*** | 0.798 | -0.208*** | 0.812 | |
| 餐饮店 | 0.344*** | 1.410 | 0.296*** | 1.344 | |
| 网吧 | 0.119** | 1.126 | 0.085* | 1.089 | |
| 学校 | -0.141*** | 0.868 | -0.133*** | 0.875 | |
| 监管力度(控制变量) | |||||
| 警力布控点 | 0.037 | 1.037 | 0.052 | 1.054 | |
| 社会失序(控制变量) | |||||
| 社区低收入人群比例 | 0.160*** | 1.174 | 0.140*** | 1.151 | |
| 社区高收入人群比例 | -0.016 | 0.984 | -0.085* | 0.918 | |
| 常量 | 4.432*** | 84.070 | 3.906*** | 49.710 | |
| AIC | 11720.507 | 10349.722 | |||
| BIC | 11772.927 | 10402.142 | |||
注:*、**、***分别表示p<0.05、p<0.01、p<0.001。 |
真诚感谢外审专家在论文评审中对本文语言梳理、指标解释、结果分析及结论提炼等方面提出的宝贵意见和修改建议,使本文更加严谨充实,在此表示衷心感谢!
| [1] |
|
| [2] |
|
| [3] |
李钢, 王皎贝, 徐婷婷, 等. 中国COVID-19疫情时空演化与综合防控. 地理学报, 2020, 75(11): 2475-2489.
[
|
| [4] |
靳高风, 杨皓翔, 何天娇. 疫情防控常态化背景下中国犯罪形势变化与趋势: 2020—2021 年中国犯罪形势分析与预测. 中国人民公安大学学报(社会科学版), 2021, 37(3): 1-14.
[
|
| [5] |
|
| [6] |
张新宇, 陈鹏. 新冠疫情防控措施对入室盗窃犯罪热点的影响: 基于北京市主城区的案例研究. 地理科学进展, 2023, 42(2): 328-340.
[
|
| [7] |
郑滋椀, 姜超, 汪婕, 等. 常态化防疫背景下城市盗窃犯罪的时空演变及其机理研究: 以浙江海宁市为例. 地理科学进展, 2023, 42(2): 341-352.
[
|
| [8] |
|
| [9] |
|
| [10] |
|
| [11] |
|
| [12] |
|
| [13] |
林亚刚. 暴力犯罪的内涵与外延. 现代法学, 2001, 23(6): 138-142.
[
|
| [14] |
龙冬平, 柳林, 陈建国, 等. 街头抢劫者前犯罪经历对其后作案地选择的影响. 地理科学进展, 2020, 39(5): 815-828.
[
|
| [15] |
|
| [16] |
|
| [17] |
|
| [18] |
龙冬平, 柳林, 冯嘉欣, 等. 社区环境对入室盗窃和室外盗窃影响的对比分析: 以ZG市ZH半岛为例. 地理学报, 2017, 72(2): 341-355.
[
|
| [19] |
张延吉, 庄宇丹, 邓伟涛, 等. 盗窃犯罪易发地的构成、影响及其区域异质性: 基于地理探测器方法. 地理研究, 2022, 41(11): 2884-2896.
[
|
| [20] |
|
| [21] |
宋广文, 肖露子, 周素红, 等. 居民日常活动对扒窃警情时空格局的影响. 地理学报, 2017, 72(2): 356-367.
[
|
| [22] |
|
| [23] |
肖露子, 柳林, 宋广文, 等. 基于理性选择理论的社区环境对入室盗窃的影响研究. 地理研究, 2017, 36(12): 2479-2491.
[
|
| [24] |
|
| [25] |
龙冬平, 陈再齐, 徐铭恩, 等. 人类命运共同体理念的理论分析及其在抗疫实践中的应用. 热带地理, 2021, 41(4): 694-707.
[
|
| [26] |
王霞, 唐三一, 陈勇, 等. 新型冠状病毒肺炎疫情下武汉及周边地区何时复工? 数据驱动的网络模型分析. 中国科学:数学, 2020, 50(7): 969-978.
[
|
| [27] |
张桂文, 吴桐. 新冠肺炎疫情对中国就业的影响研究. 中国人口科学, 2020, (3): 11-20, 126.
[
|
| [28] |
|
| [29] |
靳高风, 张雍锭, 郭兆轩. 2021—2022年中国犯罪形势分析与预测. 中国人民公安大学学报(社会科学版), 2022, 38(2): 1-12.
[
|
| [30] |
肖露子, 柳林, 周素红, 等. ZG市工作日地铁站点扒窃案件的时空分布及其影响因素. 地理科学, 2018, 38(8): 1227-1234.
[
|
| [31] |
柳林, 李璐, 周翰林, 等. 警用视频监控的犯罪转移和效益扩散: 以苏州市姑苏区为例. 地理科学, 2020, 40(10): 1601-1609.
[
|
| [32] |
|
| [33] |
|
| [34] |
毛媛媛, 李凤仪, 殷玲, 等. 基于网络形态的街道空间环境与“两抢一盗”犯罪的关系研究: 以HS市原DP区为例. 地理研究, 2022, 41(11): 2866-2883.
[
|
| [35] |
龙冬平, 刘丹红, 陈建国. ZG市街头抢劫者作案地选择及其影响因素研究. 地理研究, 2022, 41(5): 1422-1436.
[
|
| [36] |
|
| [37] |
赵梓渝, 刘大千, 肖建红, 等. 基于犯罪模式理论的犯罪出行空间特征与影响因素: 以长春市南关区扒窃为例. 地理研究, 2021, 40(3): 885-899.
[
|
| [38] |
柳林, 谭敏, 龙冬平, 等. 城市社会安全事件的空间分布特征研究: 以深圳市为例. 中国名城, 2021, 35(7): 34-40.
[
|
| [39] |
|
| [40] |
|
| [41] |
柳林, 张春霞, 冯嘉欣, 等. ZG市诈骗犯罪的时空分布与影响因素. 地理学报, 2017, 72(2): 315-328.
[
|
| [42] |
|
| [43] |
|
| [44] |
|
| [45] |
|
| [46] |
|
| [47] |
|
| [48] |
|
| [49] |
|
| [50] |
|
| [51] |
柳林, 刘慧婷, 陈建国, 等. “雷霆扫毒”对贩卖毒品犯罪的影响及后续时空分布变化: 以ZG市主城区为例. 地理学报, 2022, 77(6): 1461-1474.
[
|
| [52] |
周素红, 谢蔚翰, 宋广文, 等. 土地利用对街头抢劫影响的空间分异模式: 以H市为例. 地理科学, 2017, 37(6): 885-894.
[
|
| [53] |
|
| [54] |
|
/
| 〈 |
|
〉 |