
人口粘性的时空演变及其对乡村人口规模的影响
|
朱纪广(1984-),男,河南上蔡人,博士,教授,主要研究方向为区域经济与城乡发展。E-mail: jgzhu2020@163.com |
收稿日期: 2024-01-16
录用日期: 2024-05-09
网络出版日期: 2024-08-09
基金资助
国家自然科学基金项目(42171182)
国家自然科学基金项目(42371195)
河南省高等学校青年骨干教师培育计划(2021GGJS069)
河南省高校科技创新人才支持计划(24HASTIT020)
河南省自然科学优秀青年基金项目(222300420021)
河南省高等学校哲学社会科学基础研究重大项目(2024-JCZD-22)
Temporal and spatial evolution of population stickiness and its impact on rural population size
Received date: 2024-01-16
Accepted date: 2024-05-09
Online published: 2024-08-09
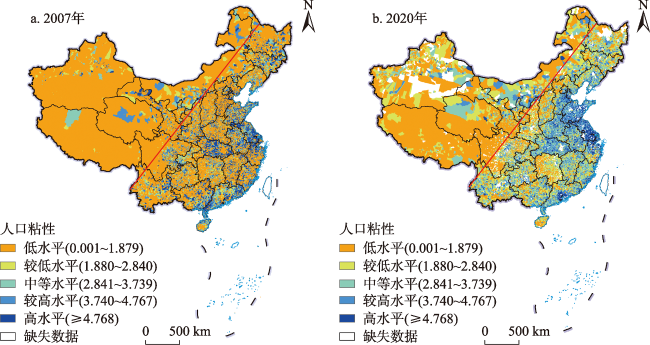
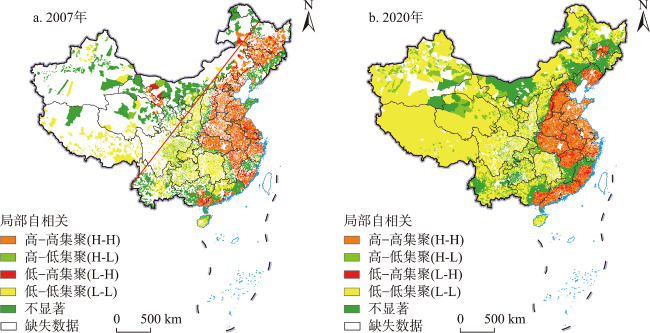
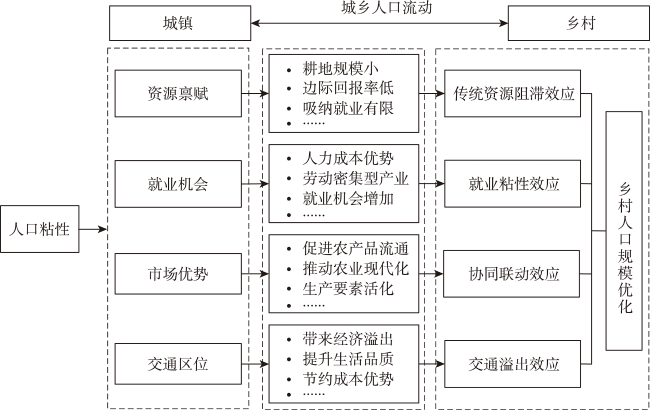
党中央国务院提出“适应乡村人口规模变化趋势”,这对优化村庄布局、产业结构和公共服务配置具有重要的实践意义。本文系统阐述乡村地域人口粘性内涵,通过集成地理环境和人文经济多源数据,综合运用熵值法、空间自相关和多元线性回归等方法,定量刻画中国镇域尺度人口粘性的空间分布规律,深入解析人口粘性对乡村人口规模的影响效应。研究结果:在时序演变上,乡村地域人口粘性具有持续减小趋势;在空间演变上,乡村地域人口粘性总体分布呈“东南高、西北低”的格局,与中国乡村人口分布的总体特征一致;人口粘性的高-高集聚型和低-低集聚型处于扩散趋势。基于人口粘性的传统资源禀赋对乡村人口规模具有阻滞效应,就业机会、市场化程度和交通便利性对乡村人口规模分别具有就业粘性效应、协同联动效应和交通溢出效应。从区域效应看,东部地区、中部地区、西部地区和东北地区的人口粘性对乡村人口规模的影响效应具有促进作用,但其形成机制不同。该研究有效揭示了乡村人口规模分布、产业布局原理,进一步拓展了经济地理学解释乡村人口规模分布的学理基础,为整合乡村资源要素、缩小城乡差距、完善乡村基础设施和提高乡村运行效率提供施策依据。
朱纪广 , 许家伟 , 李小建 . 人口粘性的时空演变及其对乡村人口规模的影响[J]. 地理研究, 2024 , 43(8) : 2065 -2083 . DOI: 10.11821/dlyj020240058
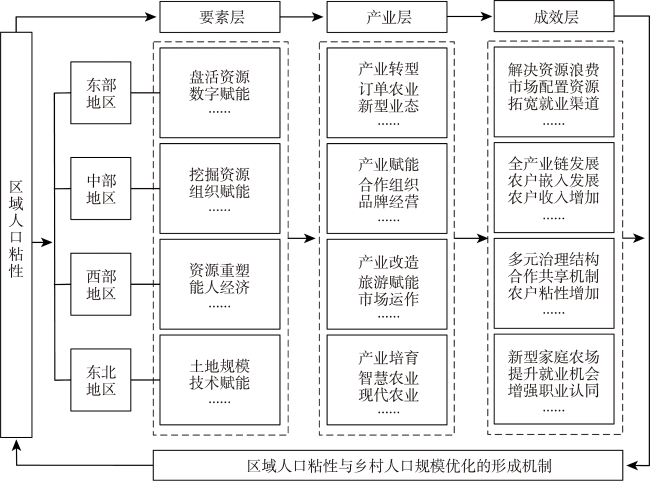
The CPC Central Committee and the State Council proposed “adapting to the changing trend of rural population size”, which has important practical significance for optimizing village layout, industrial structure and public service allocation. In this paper, the connotation of population stickiness in rural areas is systematically expounded. By integrating multi-source data of geographical environment and humanistic economy, and utilizing methods such as entropy method, spatial autocorrelation, and multiple linear regression, the spatial distribution pattern of population stickiness at town size in China was quantitatively characterized, and the effect of population stickiness on rural population size is deeply analyzed. The results are as follows: in terms of temporal evolution, the population stickiness of rural areas has a continuous decreasing trend; in terms of spatial evolution, the population stickiness in rural areas presents a pattern of “high in southeast and low in northwest”, which is consistent with the rural population distribution in China; the high-high and low-low agglomerations of population stickiness are in the diffusion trend. The traditional resource endowment based on population stickiness has a blocking effect on rural population size, while employment opportunity, marketization degree and traffic accessibility have employment stickiness effect, synergistic linkage effect and traffic spillover effect on rural population size, respectively. From the perspective of regional effect, the population stickiness in eastern, central, western and northeastern regions has a promoting effect on rural population size, but its formation mechanisms are different. The eastern region revitalizes idle rural resources and innovates rural digital economy through market mechanisms, promotes industrial transformation, and increases the employment income of farmers. The key to the central region lies in tapping into the local resource endowment and organizational empowerment, though the development of modern agriculture and diversified cooperative organizations, to form brand effect and drive the development of the entire industrial chain of farmers, so that farmers can be embedded in local specialized cooperative organizations. The western region mainly reshapes the resource endowment of rural areas through “talented people”, and then forms a multiple governance mechanism, a cooperation and sharing mechanism, and a community of interests through tourism empowerment and market-oriented operation. The northeastern region takes advantages of land size, transforms traditional agriculture and cultivates new industrial forms through technological empowerment, realizes the connection between new family farms and the market, and enhances employment opportunities and the sense of professional identity of farmers. This study effectively reveals the principles of rural population size distribution and industrial layout, further expands the theoretical basis of economic geography to explain rural population size distribution, and provides policy basis for integrating rural resource elements, narrowing the urban-rural gap, improving rural infrastructure and enhancing rural operation efficiency.
表1 人口粘性指标体系Tab. 1 The index system of population stickiness |
| 目标层 | 系统层 | 指标层 | 单位 | 方向 | 指标说明 |
|---|---|---|---|---|---|
| 人口粘性 | 资源禀赋 | 人均土地面积 | hm2/人 | 正/负 | 反映农户资源禀赋情况 |
| 就业机会 | 工业企业个数 | 个 | 正 | 反映农户就业机会 | |
| 市场化程度 | 综合商店或超市个数 | 个 | 正 | 反映乡村市场化程度 | |
| 交通便利性 | 交通网密度 | km/km2 | 正/负 | 反映农户交通便利性 |
表2 影响因素指标的选择和共线性检验Tab. 2 Selection of influencing factors and collinearity test |
| 变量 | 符号 | 指标名称 | 2007年 | 2013年 | 2020年 |
|---|---|---|---|---|---|
| 人口粘性综合得分 | Psti | 人口粘性综合得分 | 1.139 | 1.199 | 1.379 |
| Slop | 坡度 | 2.159 | 2.050 | 2.152 | |
| 自然地理条件 | Altitu | 高程 | 2.338 | 2.133 | 2.369 |
| Densi | 河网密度 | 1.105 | 1.087 | 1.106 | |
| 所处区域经济水平 | Pergdp | 人均国内生产总值 | 1.502 | 1.079 | 1.360 |
| 初始发展基础 | Popu04 | 2004年乡村人口规模 | 1.352 | 1.129 | 1.155 |
表3 人口粘性指标体系的权重Tab. 3 The weight of population stickiness index system |
| 变量 | 2007年 | 2013年 | 2020年 |
|---|---|---|---|
| 资源禀赋 | 0.013 | 0.030 | 0.075 |
| 就业机会 | 0.623 | 0.479 | 0.592 |
| 市场化程度 | 0.359 | 0.487 | 0.314 |
| 交通便利性 | 0.006 | 0.004 | 0.019 |
表4 2007—2020年人口粘性变化特征Tab. 4 Changing characteristics of population stickiness (2007-2020) |
| 年份 | 人口粘性 最大值 | 人口粘性 最小值 | 人口粘性 平均值 |
|---|---|---|---|
| 2007 | 8.876 | 0.240 | 3.606 |
| 2013 | 8.480 | 0.184 | 2.887 |
| 2020 | 8.750 | 0.419 | 2.759 |
表5 2007—2020年人口粘性类型划分及其变动情况Tab. 5 Types of population stickiness and their changes (2007-2020) |
| 人口粘性类型 | 2007年数量(个) | 2020年数量(个) | 数量变化(个) |
|---|---|---|---|
| 高水平(≥4.768) | 6019 | 2341 | -3678 |
| 较高水平(3.740~4.767) | 4033 | 5507 | 1474 |
| 中等水平(2.841~3.739) | 3204 | 7744 | 4540 |
| 较低水平(1.880~2.840) | 2194 | 6323 | 4129 |
| 低水平(0.001~1.879) | 13520 | 7055 | -6465 |
表6 “胡焕庸线”两侧人口粘性类型分布情况Tab. 6 Distribution of population stickiness types on both sides of “Hu Line” |
| 年份 | 人口粘性类型 | 胡焕庸线西北区域 | 胡焕庸线东南区域 | ||
|---|---|---|---|---|---|
| 数量(个) | 占比(%) | 数量(个) | 占比(%) | ||
| 2007 | 高水平(≥4.768) | 133 | 3.674 | 6082 | 16.164 |
| 较高水平(3.740~4.767) | 146 | 4.033 | 4514 | 11.997 | |
| 中等水平(2.841~3.739) | 176 | 4.862 | 3725 | 9.900 | |
| 较低水平(1.880~2.840) | 177 | 4.890 | 2412 | 6.410 | |
| 低水平(0.001~1.879) | 2988 | 82.541 | 20893 | 55.529 | |
| 合计 | 3620 | 100.000 | 37626 | 100.000 | |
| 2020 | 高水平(≥4.768) | 33 | 1.102 | 2333 | 8.979 |
| 较高水平(3.740~4.767) | 152 | 5.075 | 5333 | 20.525 | |
| 中等水平(2.841~3.739) | 382 | 12.755 | 7364 | 28.342 | |
| 较低水平(1.880~2.840) | 576 | 19.232 | 5749 | 22.126 | |
| 低水平(0.001~1.879) | 1852 | 61.836 | 5204 | 20.028 | |
| 合计 | 2995 | 100.000 | 25983 | 100.000 | |
表7 人口粘性空间自相关系数值(Moran's I)Tab. 7 Spatial autocorrelation coefficient of population stickiness (Moran's I) |
| 年份 | Moran's I | P检验值 | Z检验值 |
|---|---|---|---|
| 2007 | 0.579 | 0.000 | 83.047 |
| 2013 | 0.688 | 0.000 | 29.706 |
| 2020 | 0.776 | 0.000 | 22.276 |
表8 人口粘性对乡村人口规模的总体影响回归结果Tab. 8 The overall effect of population stickiness on rural population size |
| 变量 | 2007年 | 2013年 | 2020年 | |||||
|---|---|---|---|---|---|---|---|---|
| 模型1 | 模型2 | 模型3 | 模型4 | 模型5 | 模型6 | |||
| Psti | 0.205*** (0.011) | 0.172*** (0.011) | 0.370*** (0.013) | 0.044*** (0.009) | 0.283*** (0.011) | 0.024** (0.009) | ||
| Slop | -0.021*** (0.005) | -0.040*** (0.003) | -0.015*** (0.003) | |||||
| Altitu | -0.063*** (0.004) | 0.002 (0.003) | 0.003 (0.003) | |||||
| Densi | 0.041*** (0.002) | 0.004** (0.001) | 0.010*** (0.001) | |||||
| Pergdp | -0.044*** (0.006) | 0.009* (0.004) | -0.057*** (0.004) | |||||
| Popu04 | 0.237** (0.003) | 0.828*** (0.005) | 0.635*** (0.008) | |||||
| 常数项 | 7.304*** (0.013) | 7.506*** (0.027) | 6.837*** (0.016) | 1.058*** (0.061) | 7.303*** (0.013) | 2.742*** (0.062) | ||
| R2 | 0.027 | 0.526 | 0.044 | 0.640 | 0.045 | 0.620 | ||
| 德宾-沃森检验 | 1.801 | 1.847 | 0.845 | 1.979 | 1.898 | 1.903 | ||
| 样本数 | 16623 | 16623 | 16876 | 16876 | 14449 | 14449 | ||
注:**和***分别表示在5%和1%水平下显著;表格中括号内数值为稳健标准误。 |
图4 人口粘性对乡村人口规模的影响机制Fig. 4 The influence mechanism of population stickiness on rural population size |
表9 人口粘性各系统层对乡村人口规模的影响效应回归结果Tab. 9 The effect of sub-layers of population stickiness on rural population size |
| 变量 | 资源禀赋 | 就业机会 | 市场化程度 | 交通便利性 |
|---|---|---|---|---|
| Psti | -0.239*** (0.005) | 0.062*** (0.003) | 0.048*** (0.003) | 0.011*** (0.003) |
| Slop | 0.027*** (0.004) | -0.029*** (0.004) | -0.016*** (0.004) | -0.032*** (0.004) |
| Altitu | -0.022*** (0.003) | -0.020*** (0.004) | -0.033*** (0.004) | -0.031*** (0.004) |
| Densi | 0.017*** (0.003) | 0.027*** (0.002) | 0.031*** (0.002) | 0.031*** (0.002) |
| Pergdp | -0.109*** (0.004) | -0.113*** (0.005) | -0.084*** (0.005) | -0.076*** (0.005) |
| Popu04 | 0.139*** (0.007) | 0.168*** (0.008) | 0.171*** (0.008) | 0.178*** (0.009) |
| 常数项 | 6.315*** (0.059) | 6.163*** (0.066) | 6.235*** (0.068) | 6.356*** (0.071) |
| R2 | 0.371 | 0.243 | 0.229 | 0.219 |
| 德宾-沃森检验 | 0.741 | 0.493 | 0.474 | 0.449 |
| 样本数 | 14 739 | 14 739 | 14 739 | 14 739 |
注:***表示在1%水平下显著;表格中括号内数值为稳健标准误。 |
表10 人口粘性对乡村人口规模的区域影响效应Tab. 10 Regional effect of population stickiness on rural population size |
| 变量 | 东部地区 | 中部地区 | 西部地区 | 东北地区 |
|---|---|---|---|---|
| Psti | 3.714*** (0.051) | 2.803*** (0.105) | 3.768*** (0.067) | 3.650*** (0.145) |
| Slop | 0.387*** (0.030) | 0.100*** (0.031) | 0.113*** (0.027) | -0.172*** (0.037) |
| Altitu | -0.082* (0.032) | -0.114** (0.040) | -0.063*** (0.017) | 0.121*** (0.027) |
| Densi | -0.051*** (0.010) | -0.047*** (0.011) | -0.038** (0.012) | -0.039** (0.018) |
| Pergdp | -0.596*** (0.023) | -0.415** (0.036) | -0.339** (0.029) | -0.461*** (0.040) |
| Popu04 | 0.322*** (0.035) | -0.257*** (0.055) | -0.368*** (0.041) | -0.342*** (0.094) |
| 常数项 | 0.262 (0.339) | 6.411*** (0.515) | 6.124*** (0.327) | 5.153*** (0.681) |
| R2 | 0.611 | 0.358 | 0.456 | 0.568 |
| 德宾-沃森检验 | 1.924 | 2.009 | 1.954 | 1.949 |
| 样本数 | 5952 | 4736 | 6582 | 1417 |
注:*、**、***分别表示在10%,5%和1%水平下显著;表格中括号内数值为稳健标准误。 |
真诚感谢匿名评审专家在论文评审中所付出的时间和精力,专家对本文摘要、引言、概念内涵、指标体系和结果分析等方面的修改意见,使本文获益匪浅!
| [1] |
|
| [2] |
|
| [3] |
|
| [4] |
|
| [5] |
|
| [6] |
|
| [7] |
|
| [8] |
|
| [9] |
周扬, 黄晗, 刘彦随. 中国村庄空间分布规律及其影响因素. 地理学报, 2020, 75(10): 2206-2223.
[
|
| [10] |
李小建, 许家伟, 海贝贝. 县域聚落分布格局演变分析: 基于1929—2013年河南巩义的实证研究. 地理学报, 2015, 70(12): 1870-1883.
[
|
| [11] |
刘彦随. 中国乡村振兴规划的基础理论与方法论. 地理学报, 2020, 75(6): 1120-1133.
[
|
| [12] |
李小建. 欠发达区乡村聚落空间演变. 北京: 科学出版社, 2019: 2.
[
|
| [13] |
吕敏娟, 曹小曙. 1980—2016年黄土高原地区人口和可达性异速标度分析. 地理科学进展, 2020, 39(11): 1884-1897.
[
|
| [14] |
|
| [15] |
马雯秋, 朱道林, 姜广辉. 面向乡村振兴的农村居民点用地结构转型研究. 地理研究, 2022, 41(10): 2615-2630.
[
|
| [16] |
|
| [17] |
|
| [18] |
|
| [19] |
冯旭, 张湛新, 潘传杨, 等. 人口收缩背景下的乡村活力分析与实践: 基于美国、德国、日本、英国的比较研究. 国际城市规划, 2022, 37(3): 42-49.
[
|
| [20] |
|
| [21] |
|
| [22] |
|
| [23] |
|
| [24] |
|
| [25] |
|
| [26] |
|
| [27] |
|
| [28] |
|
| [29] |
|
| [30] |
|
| [31] |
|
| [32] |
|
| [33] |
|
| [34] |
|
| [35] |
|
| [36] |
|
| [37] |
骆永民, 骆熙, 汪卢俊. 农村基础设施、工农业劳动生产率差距与非农就业. 管理世界, 2020, 36(12): 91-121.
[
|
| [38] |
魏静. 交通基础设施、产业集聚与经济增长. 重庆: 西南财经大学博士论文, 2019: 59-63.
[
|
| [39] |
|
| [40] |
关付新. 华北平原种粮家庭农场土地经营规模探究: 以粮食大省河南为例. 中国农村经济, 2018, (10): 22-38.
[
|
| [41] |
李晓丽, 吴威, 刘玮辰. 基于国际公路运输链的“一带一路”区域公路通达性分析. 地理研究, 2020, 39(11): 2552-2567.
[
|
| [42] |
唐永, 李小建, 胡雪瑶, 等. 快速城镇化中传统农区小城镇规模演变与影响因素. 经济地理, 2023, 43(10): 148-159.
[
|
| [43] |
张文忠. 经济区位论. 北京: 商务印书馆, 2022: 309.
[
|
| [44] |
曲霞, 文晓巍. 乡村振兴背景下韧性乡村的影响因素与示范带耦合分析. 学术研究, 2022, (12): 90-95.
[
|
| [45] |
项继权, 毛斌菁. 要素市场化背景下乡村治理体制的改革. 华中师范大学学报: 人文社会科学版, 2021, 60(2): 1-9.
[
|
| [46] |
孙欣, 毕如田, 刘慧芳, 等. 贫困山区耕地细碎化对农户生计策略的影响: 以左权县清漳河流域87个村为例. 中国土地科学, 2018, 32(2): 40-47.
[
|
/
| 〈 |
|
〉 |