
长江经济带城市群城市关联网络格局及影响机制——基于高铁站区承接企业视角
|
汪德根(1973-),男,安徽歙县人,博士,教授,博士生导师,主要研究城乡发展与区域规划。E-mail: wdg713@163.com |
收稿日期: 2024-01-23
录用日期: 2024-06-06
网络出版日期: 2024-12-09
基金资助
国家社会科学基金项目(22BJL058)
苏州大学新型城镇化与社会治理协同创新中心研究项目
Network patterns and influence mechanisms of city linkages in the urban agglomeration of the Yangtze River Economic Belt: From the perspective of undertaking enterprises in high-speed railway station areas
Received date: 2024-01-23
Accepted date: 2024-06-06
Online published: 2024-12-09
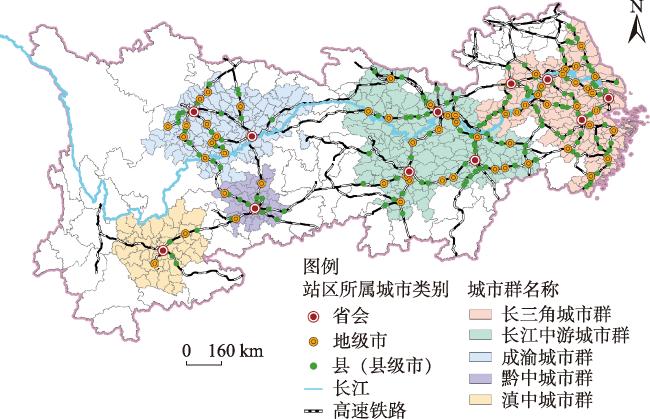
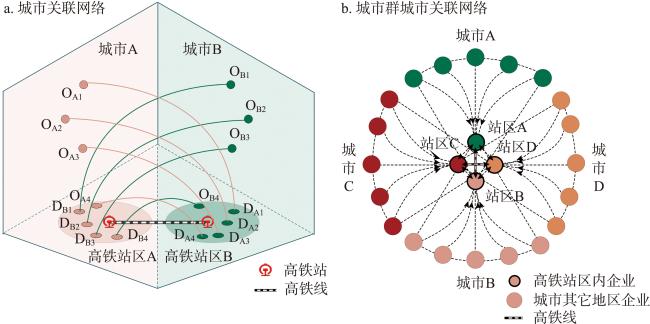
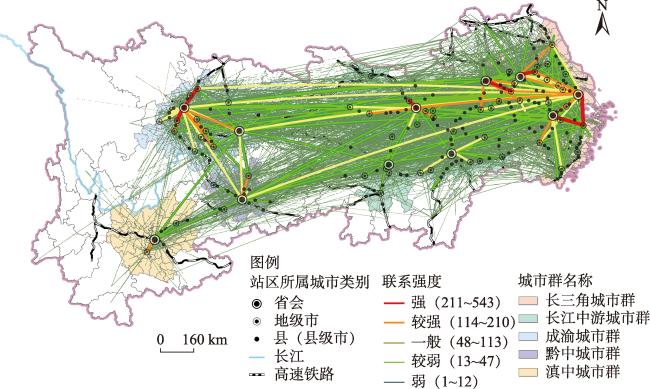
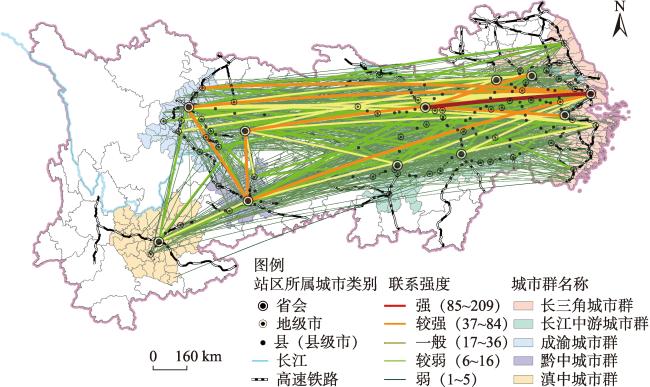
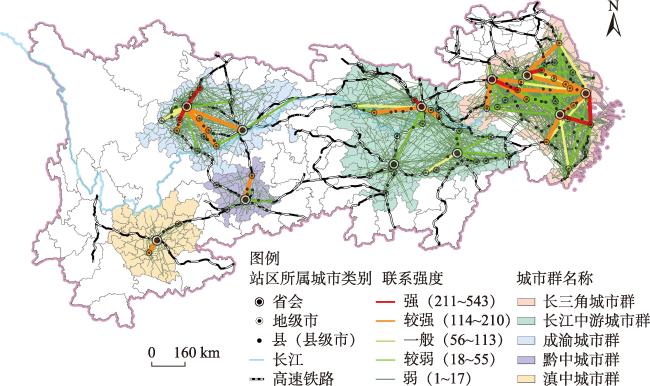
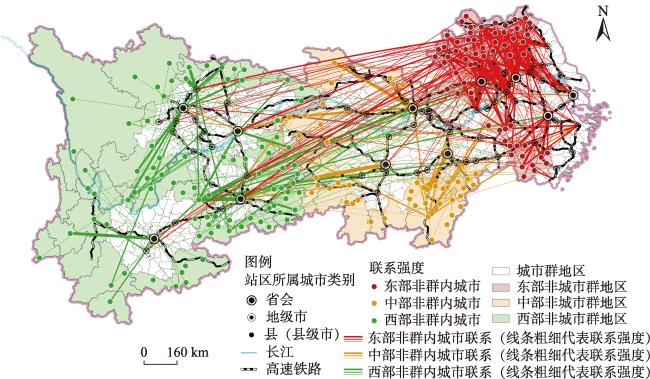
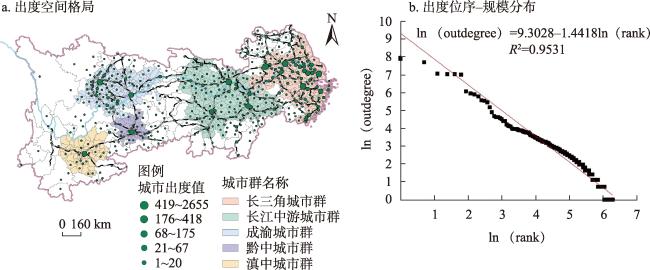
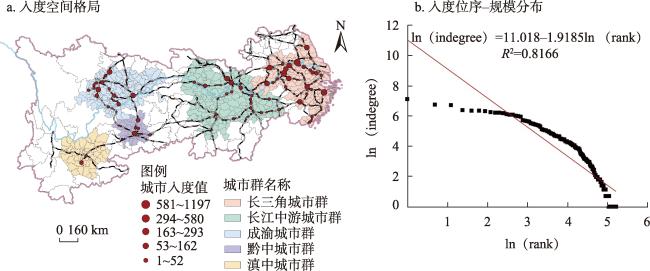
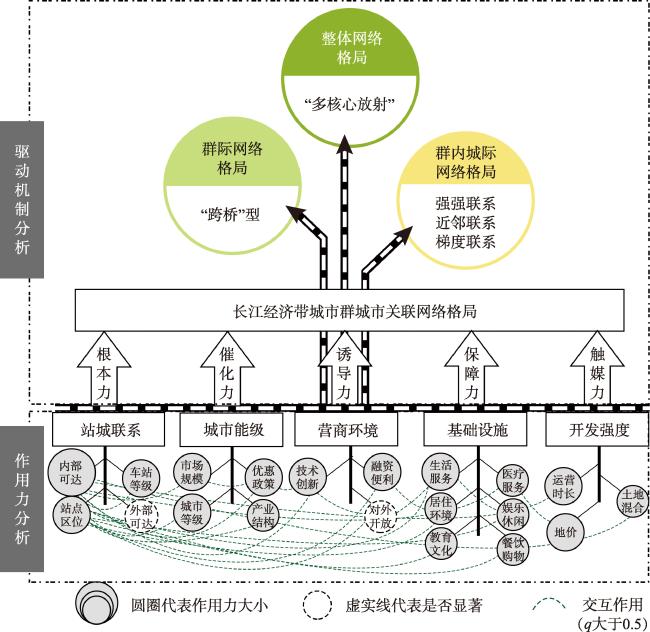
高铁站区具有促进交通、产业、城市融合发展的重要作用,已成为城市产生经济联系及其空间关联的重要载体。本文以长江经济带五大城市群为研究单元,构建高铁站区与城市间“总-分”企业视角下隶属联系网络模型,采用社会网络分析、GIS空间分析等方法刻画高铁站区承接企业视角下长江经济带城市群城市关联网络格局,并进一步利用地理探测器模型揭示网络形成的影响机理。研究发现:高铁站区承接企业视角下,① 长江经济带城市关联网络整体呈“多核心放射状”空间格局,总体连通性和集中性较强,廊道效应明显,中西部网络发育不够完备,呈现出“东密西疏”网络格局特征;网络小团体特征较为明显,中部城市群“内联外拓”和东、西部城市群“内强外弱”的网络特性明显;② 长江经济带城市群群际网络呈“跨桥状”联系格局,城市群群内城际关联网络格局表现出“强强联系”“梯度联系”“邻近联系”三种特征;③ 长江经济带城市关联网络的出度节点空间分布呈“高等级零星点缀,低等级众多遍布”格局特征,而入度节点呈“高等级族群成片,低等级串珠成线”空间分异格局特征;④ 城市群关联网络格局受城市能级、站区营商环境、站区基础设施、站区开发程度、站-城联系度5个维度因子交互作用的影响,其中,内部可达性、城市等级、站点区位和政府优惠政策等因子对高铁站区承接城市关联网络格局形成的作用力明显。
汪德根 , 翟云利 , 赵美风 , 王悦 . 长江经济带城市群城市关联网络格局及影响机制——基于高铁站区承接企业视角[J]. 地理研究, 2024 , 43(12) : 3191 -3214 . DOI: 10.11821/dlyj020240078
High-speed railway station areas play an important role in promoting the integration of transportation, industry and urban development, and have become an important carrier for cities to generate economic ties and their spatial associations. This paper takes the five major urban agglomerations in the Yangtze River Economic Belt (YREB) as the research unit, constructs the affiliation network model from the perspective of “total-sub” enterprises between high-speed rail station areas and cities, adopts the methods of social network analysis and GIS spatial analysis to portray the affiliation network pattern of the urban agglomerations in the YREB in the perspective of the enterprises undertaking high-speed rail station areas, and further utilizes the geographic detector model to reveal the role mechanism of the network formation. The results found that: (1) The overall network of cities in the YREB shows a “multi-core radial” spatial pattern, with strong connectivity and concentration, obvious corridor effect, and the network in the central and western parts of the country is not developed enough. The network pattern is characterized by “dense in the east and sparse in the west”; the characteristics of small groups in the network are more obvious, and the network characteristics of “inward connection and outward expansion” in the central urban agglomeration and “strong inside and weak outside” in the eastern and western urban agglomerations are obvious; (2) The inter-group network of the urban agglomerations in the YREB under the viewpoint of the high-speed railway station area undertaking enterprises is presented in the form of “inter-group network”. (2) The inter-city network of the urban agglomerations from the perspective of enterprises receiving high-speed rail station areas shows a “bridge-crossing” linkage pattern, and the network pattern of inter-city links within the urban agglomerations shows “strong linkage”, “gradient linkage” and “neighboring linkage”. (3) The spatial distribution of out-degree nodes of the urban association network from the perspective of the high-speed railway station area receiving enterprises is characterized by a pattern of “high-grade scattered dots, low-grade numerous”, while the in-degree nodes are characterized by a pattern of “high-grade clusters, and low-grade clusters”. High-grade clusters become pieces, and low-grade beads become lines; (4) The pattern of urban agglomeration association network under the perspective of high-speed rail station area receiving enterprises is affected by the interaction of five dimensional factors, namely, city level, station area business environment, station area infrastructure, station area development degree, and station-city linkage, among which, the factors such as internal accessibility, city level, station location, and government preferential policies have a significant influence on the urban agglomeration association network. Among them, internal accessibility, city grade, station location and governmental preferential policies play an obvious role in the formation of the network pattern of city connections in the high-speed railwaystation area.
表1 解释变量定义及说明Tab. 1 Definition and description of explanatory variables |
| 变量类型 | 变量名称 | 指标计算方法 |
|---|---|---|
| 城市能级 (ζ1) | 市场规模(X1) | 设站城市国内生产总值(GDP/亿元),划分4个等级 |
| 城市等级(X2) | 依据国务院《关于调整城市规模划分标准的通知》,将设站城市分为超大城市、特大城市、I型大城市、II型大城市、中等城市、I型小城市和II型小城市7个等级,并以最低等级对县级城市进行赋值 | |
| 产业结构(X3) | 设站城市第三产业增加值/GDP(%),划分4个等级 | |
| 优惠政策(X4) | 设站城市是否有省级开发园区和国家级开发园区,有国家级开发园区的赋值为2,省级的赋值为1,其他为0 | |
| 站区营商环境 (ζ2) | 对外开放水平(X5) | 高铁站区外资及中外合资企业数占企业总数的比值(%),划分4个等级 |
| 融资便利程度(X6) | 高铁站区金融机构数量占企业总数的比重(%),划分4个等级 | |
| 技术创新水平(X7) | 高铁站区高新技术产业数量占企业总数的比重(%),划分4个等级 | |
| 站区基础设施 (ζ3) | 居住环境(X8) | 高铁站区商务住宅、住宿等数量占POI总数的比重(%),划分4个等级 |
| 教育文化(X9) | 高铁站区科教文化设施数量占POI总数的比重(%),划分4个等级 | |
| 医疗服务(X10) | 高铁站区医疗设施数量占POI总数的比重(%),划分为4个等级 | |
| 娱乐休闲(X11) | 高铁站区休闲娱乐场所数量占POI总数的比重(%),划分4个等级 | |
| 餐饮购物(X12) | 高铁站区餐饮购物设施数量占POI总数的比重(%),划分4个等级 | |
| 生活服务(X13) | 高铁站区生活服务设施数量占POI总数的比重(%),划分4个等级 | |
| 站区开发程度 (ζ4) | 土地功能混合度(X14) | 式中:H为土地功能混合度;Pi为高铁站区第i类POI数量占总POI数量的比例;n为站点地区内POI类别的总数[35,36],划分4个等级 |
| 地价(X15) | 高铁站区新房交易价格均值(元/m2)[35],划分4个等级 | |
| 运营时长(X16) | 高铁站统计期始到统计期末的年份数(年) | |
| 站-城联系度 (ζ5) | 外部可达性(X17) | 运用ArcGIS网络分析法和OD成本矩阵测算高铁站加权平均出行时间[6] |
| 内部可达性(X18) | 式中:D为路网密度(km/km2);L为道路长度(km),M为高铁站区面积(km2)。本文用路网密度表征站区内部可达性,并划分4个等级 | |
| 站点区位(X19) | 式中:Q为距离指数;d为高铁站到城市中心的地理距离(km);S为城市建成区的面积(km2)[34],划分4个等级 | |
| 车站等级(X20) | 根据《全国铁路车站等级核定办法》,将高铁站划分为特等站、一等站、二等站、三等站、四等站、五等站6个等级,依次赋值6~1 |
注:除特殊说明外,各指数均用自然间断点法进行分级处理。 |
表2 长江经济带城市群网络分派指数特征Tab. 2 Characteristics of E-I index of urban agglomerations in the Yangtze River Economic Belt |
| 城市群 | E-I指数 | 群内城市网络 | 群外城市网络 | |||
|---|---|---|---|---|---|---|
| 联系强度 | 网络密度 | 联系强度 | 网络密度 | |||
| 长三角 | -0.961* | 7927 | 0.3983 | 1000 | 0.0080 | |
| 长江中游 | -0.883* | 2220 | 0.1348 | 1131 | 0.0083 | |
| 成渝 | -0.983* | 2655 | 0.5364 | 824 | 0.0045 | |
| 黔中 | -0.994* | 394 | 0.8473 | 579 | 0.0026 | |
| 滇中 | -0.999* | 238 | 0.7933 | 92 | 0.0004 | |
注:*表示显著性检验P<0.05。 |
表3 影响因素交互作用探测结果Tab. 3 Geodetector interaction detection results |
| 影响因素 | 内部 可达 | 城市 等级 | 优惠 政策 | 站点 区位 | 市场 规模 | 车站 等级 | 技术 创新 | 地价 | 融资 便利 | 生活 服务 | 运营 时长 | 土地 功能 | 娱乐 休闲 | 产业 结构 | 对外 开放 | 居住 环境 | 医疗 服务 | 科教 文化 | 餐饮 购物 | 外部 可达 |
|---|---|---|---|---|---|---|---|---|---|---|---|---|---|---|---|---|---|---|---|---|
| 内部可达 | 0.53*** | |||||||||||||||||||
| 城市等级 | 0.64 | 0.37*** | ||||||||||||||||||
| 优惠政策 | 0.57 | 0.40 | 0.29*** | |||||||||||||||||
| 站点区位 | 0.66 | 0.53 | 0.47 | 0.28*** | ||||||||||||||||
| 市场规模 | 0.59 | 0.42 | 0.32 | 0.44 | 0.27*** | |||||||||||||||
| 车站等级 | 0.65 | 0.41 | 0.36 | 0.41 | 0.33 | 0.26*** | ||||||||||||||
| 技术创新 | 0.62 | 0.47 | 0.40 | 0.45 | 0.36 | 0.37 | 0.22*** | |||||||||||||
| 地价 | 0.57 | 0.47 | 0.34 | 0.39 | 0.38 | 0.32 | 0.41 | 0.17*** | ||||||||||||
| 融资便利 | 0.61 | 0.58 | 0.46 | 0.36 | 0.48 | 0.47 | 0.38 | 0.37 | 0.13*** | |||||||||||
| 生活服务 | 0.56 | 0.44 | 0.36 | 0.32 | 0.32 | 0.37 | 0.33 | 0.31 | 0.21 | 0.09*** | ||||||||||
| 运营时长 | 0.60 | 0.51 | 0.38 | 0.33 | 0.40 | 0.39 | 0.35 | 0.33 | 0.22 | 0.20 | 0.09** | |||||||||
| 土地功能 | 0.55 | 0.39 | 0.30 | 0.32 | 0.34 | 0.29 | 0.27 | 0.36 | 0.27 | 0.19 | 0.21 | 0.07*** | ||||||||
| 娱乐休闲 | 0.58 | 0.45 | 0.36 | 0.31 | 0.34 | 0.37 | 0.28 | 0.29 | 0.17 | 0.15 | 0.17 | 0.14 | 0.05** | |||||||
| 产业结构 | 0.55 | 0.38 | 0.29 | 0.31 | 0.33 | 0.28 | 0.26 | 0.21 | 0.19 | 0.18 | 0.23 | 0.17 | 0.12 | 0.05** | ||||||
| 对外开放 | 0.67 | 0.42 | 0.33 | 0.34 | 0.34 | 0.36 | 0.27 | 0.26 | 0.20 | 0.32 | 0.19 | 0.18 | 0.16 | 0.13 | 0.05 | |||||
| 居住环境 | 0.63 | 0.47 | 0.37 | 0.34 | 0.31 | 0.36 | 0.27 | 0.29 | 0.18 | 0.13 | 0.14 | 0.11 | 0.11 | 0.12 | 0.16 | 0.04* | ||||
| 医疗服务 | 0.56 | 0.48 | 0.34 | 0.34 | 0.35 | 0.35 | 0.32 | 0.31 | 0.21 | 0.14 | 0.17 | 0.13 | 0.10 | 0.12 | 0.30 | 0.09 | 0.04* | |||
| 科教文化 | 0.61 | 0.43 | 0.32 | 0.32 | 0.35 | 0.34 | 0.27 | 0.34 | 0.19 | 0.14 | 0.16 | 0.13 | 0.12 | 0.14 | 0.11 | 0.12 | 0.12 | 0.04* | ||
| 餐饮购物 | 0.59 | 0.45 | 0.37 | 0.33 | 0.35 | 0.34 | 0.35 | 0.27 | 0.21 | 0.17 | 0.22 | 0.15 | 0.14 | 0.10 | 0.16 | 0.12 | 0.12 | 0.13 | 0.04* | |
| 外部可达 | 0.55 | 0.44 | 0.38 | 0.32 | 0.30 | 0.32 | 0.38 | 0.25 | 0.14 | 0.12 | 0.19 | 0.15 | 0.10 | 0.09 | 0.09 | 0.11 | 0.11 | 0.13 | 0.06 | 0.01 |
注:*、**、***分别表示在10%、5%、1%水平上显著。 |
真诚感谢匿名评审专家在论文评审中所付出的时间和精力,专家对本文高铁站区承接企业网络研究思路、企业数据分析方法、研究尺度选取、结果分析、结论梳理方面的修改意见,使本文获益匪浅。
| [1] |
王健. 中国式现代化和平发展的内生逻辑与时代要求. 社会科学, 2022, (12): 12-19.
[
|
| [2] |
王士君, 廉超, 赵梓渝. 从中心地到城市网络: 中国城镇体系研究的理论转变. 地理研究, 2019, 38(1): 64-74.
[
|
| [3] |
王丽. 高铁站区产业空间发展机制: 基于高铁乘客特征的分析. 经济地理, 2015, 35(3): 94-99.
[
|
| [4] |
王少剑, 莫惠敏, 吕慧妮, 等. 区位因素影响下高铁站区产业结构特征: 基于POI数据的实证分析. 地理学报, 2021, 76(8): 2016-2031.
[
|
| [5] |
王兰. 高速铁路对城市空间影响的研究框架及实证. 规划师, 2011, 27(7): 13-19.
[
|
| [6] |
汪德根, 范子祺, 赵美风. 长江经济带主要城市群2h出行交通圈格局特征. 地理研究, 2022, 41(5): 1388-1406.
[
|
| [7] |
黄洁, 钟业喜, 李建新, 等. 基于高铁网络的中国省会城市经济可达性. 地理研究, 2016, 35(4): 757-769.
[
|
| [8] |
|
| [9] |
李晓江. 站城融合之思考与认识. 城市交通, 2022, 20(3): 5-7.
[
|
| [10] |
刘梅, 赵曦. 城市群网络空间结构及其经济协调发展: 基于长江经济带三大城市群的比较分析. 经济问题探索, 2019, (9): 100-111.
[
|
| [11] |
方创琳. 中国城市群研究取得的重要进展与未来发展方向. 地理学报, 2014, 69(8): 1130-1144.
[
|
| [12] |
蒋金亮, 鲁嘉颐, 戈大专, 等. 长三角地区城市经济网络的时空演化特征. 长江流域资源与环境, 2023, 32(1): 24-39.
[
|
| [13] |
杨雨, 盛科荣. 中国城市网络关联格局的演变及影响因素: 基于企业网络视角. 世界地理研究, 2021, 30(6): 1208-1218.
[
|
| [14] |
宋琼, 赵新正, 李同昇, 等. 多重城市网络空间结构及影响因素: 基于有向多值关系视角. 地理科学进展, 2018, 37(9): 1257-1267.
[
|
| [15] |
刘可文, 袁丰, 潘坤友. 长江三角洲不同所有制企业空间组织网络演化分析. 地理科学, 2017, 37(5): 651-660.
[
|
| [16] |
陈建军. 中国现阶段的产业区域转移及其动力机制. 中国工业经济, 2002, (8): 37-44.
[
|
| [17] |
|
| [18] |
|
| [19] |
|
| [20] |
|
| [21] |
|
| [22] |
赵新正, 李秋平, 芮旸, 等. 基于财富500强中国企业网络的城市网络空间联系特征. 地理学报, 2019, 74(4): 694-709.
[
|
| [23] |
胡国建, 陆玉麒. 基于企业视角的城市网络研究进展、思考和展望. 地理科学进展, 2020, 39(9): 1587-1596.
[
|
| [24] |
|
| [25] |
刘莉文, 张明. 高速铁路对中国城市可达性和区域经济的影响. 国际城市规划, 2017, 32(4): 76-81, 79.
[
|
| [26] |
孙伟增, 牛冬晓. 高铁网络带动区域经济高质量发展. 中国社会科学报, 2022-08-17(3).
[
|
| [27] |
|
| [28] |
程遥, 张艺帅, 赵民. 长三角城市群的空间组织特征与规划取向探讨: 基于企业联系的实证研究. 城市规划学刊, 2016(4): 22-29.
[
|
| [29] |
唐子来, 李涛. 长三角地区和长江中游地区的城市体系比较研究: 基于企业关联网络的分析方法. 城市规划学刊, 2014, (2): 24-31.
[
|
| [30] |
黄晓东, 马海涛, 苗长虹. 基于创新企业的中国城市网络联系特征. 地理学报, 2021, 76(4): 835-852.
[
|
| [31] |
赵新正, 冯长安, 李同昇, 等. 中国城市网络的空间组织特征研究: 基于开发区联系的视角. 地理研究, 2019, 38(4): 898-910.
[
|
| [32] |
李仙德. 基于上市公司网络的长三角城市网络空间结构研究. 地理科学进展, 2014, 33(12): 1587-1600.
[
|
| [33] |
盛科荣, 杨雨, 孙威. 中国城市网络中心性的影响因素及形成机理: 基于上市公司500强企业网络视角. 地理科学进展, 2019, 38(2): 248-258.
[
|
| [34] |
赵倩, 陈国伟. 高铁站区位对周边地区开发的影响研究: 基于京沪线和武广线的实证分析. 城市规划, 2015, 39(7): 50-55.
[
|
| [35] |
邹卓君. 高铁站区用地开发及其城市中心职能实现程度研究: 基于京沪、京广高铁的实证分析. 城市规划学刊, 2018, (4): 49-55.
[
|
| [36] |
张延吉, 游永熠, 朱春武, 等. 犯罪恐惧感与犯罪活动空间分布的匹配关系及其影响因素: 以北京市为例. 地理科学, 2022, 42(6): 1024-1033.
[
|
| [37] |
刘颖, 郭琪, 贺灿飞. 城市区位条件与企业区位动态研究. 地理研究, 2016, 35(7): 1301-1313.
[
|
| [38] |
赵浚竹, 孙铁山, 李国平. 中国汽车制造业集聚与企业区位选择. 地理学报, 2014, 69(6): 850-862.
[
|
| [39] |
王劲峰, 徐成东. 地理探测器: 原理与展望. 地理学报, 2017, 72(1): 116-134.
[
|
| [40] |
韩顺法, 徐鹏飞, 马培龙. 江苏非物质文化遗产的时空分布及其影响因素. 地理科学, 2021, 41(9): 1598-1605.
[
|
| [41] |
王丽, 曹有挥, 刘可文, 等. 高铁站区产业空间分布及集聚特征: 以沪宁城际高铁南京站为例. 地理科学, 2012, 32(3): 301-307.
[
|
| [42] |
|
| [43] |
王缉宪, 林辰辉. 高速铁路对城市空间演变的影响: 基于中国特征的分析思路. 国际城市规划, 2011, 26(1): 16-23.
[
|
| [44] |
张杰, 盛科荣, 王传阳. 中国城市间金融网络的空间演化及其影响因素. 热带地理, 2022, 42(6): 928-938.
[
|
| [45] |
周文竹, 阳建强. 交通导向的城际铁路站场地区空间发展机制. 城市规划, 2010, 34(11): 88-92.
[
|
| [46] |
宋飏, 王婷婷, 张瑜, 等. 东北三省企业空间格局演化与区位选择因素. 地理科学, 2021, 41(7): 1199-1209.
[
|
| [47] |
马骁. 浙江省营商环境地区差异及对企业区位选择的影响. 金华: 浙江师范大学硕士学位论文, 2021: 33-38.
[
|
| [48] |
曹阳, 李松涛. 高铁站区空间形态变化及其应对策略. 规划师, 2017, 33(12): 80-86.
[
|
| [49] |
|
/
| 〈 |
|
〉 |