
珠三角公共交通需求-供给关系类型与影响因素分析
|
杨家文(1974-),男,湖南永州人,博士,教授,博士生导师,主要研究方向为城市交通与土地利用、公共设施与公共服务规划、城市地理学。E-mail: yangjw@pkusz.edu.cn |
收稿日期: 2024-03-01
录用日期: 2024-08-02
网络出版日期: 2024-12-09
基金资助
深圳市哲学社会科学规划课题(SZ2021B023)
国家自然科学基金项目(42271208)
Identifying and interpreting the demand-supply relationship for potential transit service improvement in China's Pearl River Delta
Received date: 2024-03-01
Accepted date: 2024-08-02
Online published: 2024-12-09
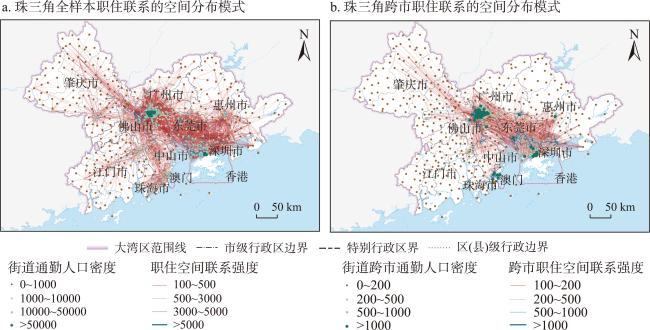
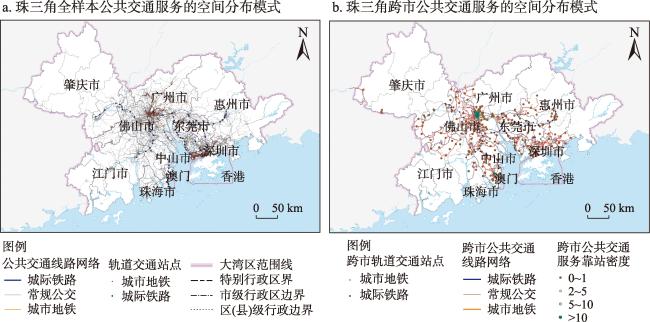
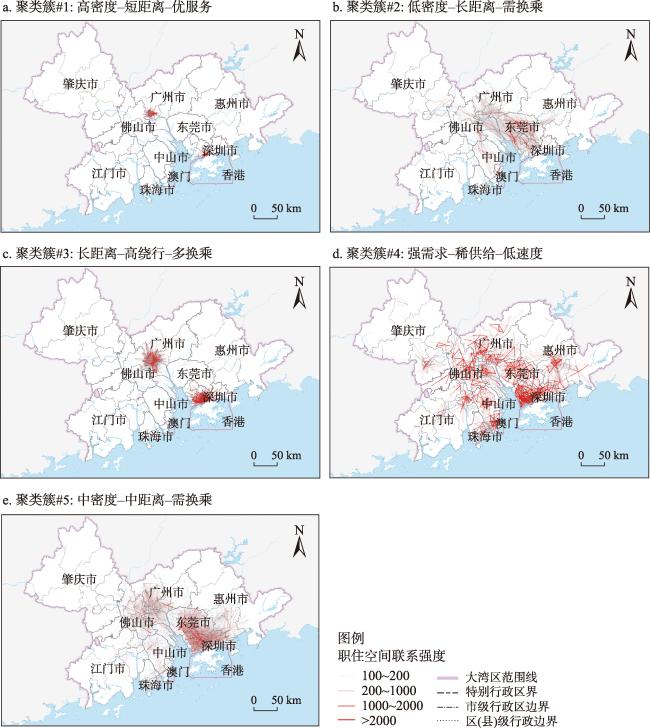
随着区域一体化发展,跨行政边界的职住联系日益紧密,城市间交通需求也逐渐增长。准确认识城市群公共交通服务现状,是实现区域协调和可持续发展的前提。以珠江三角洲城市群为例,借助位置服务大数据和公共交通服务模型,分析区域职住空间联系模式与公共交通服务的关系;基于K-means聚类,计算公共交通的需求-供给关系类型,辨析潜在服务需求;采用多元Logit模型,解释其影响因素。结果发现:① 相比市内职住联系,满足跨市通勤需求的公共交通服务供给整体质量更低、绕行更多且更依赖换乘。② 珠三角城市群内,存在不同的公共交通需求-供给关系类型,反映了多种潜在服务需求;既有跨越边界的,也有分布在市内的。③ 制度壁垒和开发强度限制分别从供给侧和需求侧影响需求-供给关系类型的形成。相应结果可以为理解和协调区域交通服务供给提供参考。
杨家文 , 陈若宇 , 段阳 . 珠三角公共交通需求-供给关系类型与影响因素分析[J]. 地理研究, 2024 , 43(12) : 3215 -3227 . DOI: 10.11821/dlyj020240170
In an era of integrated regional development, the quantity of multi-city travel is increasing, which demands for high-quality public transit services. Taking China's Pearl River Delta as a case, we analyze the jobs-housing relationship and public transit services with the location-based big data and multimodal public transit service model. Specifically, we quantify and geo-visualize the patterns of the jobs-housing relationship and transit services, identify the demand-supply relationship and potential demand for public transit service using the K-means clustering method, and analyze the causal factors using a multi-nominal logit model. We reach the following conclusions. First, transit services for inter-city commuting trips are of lower quality compared to their intra-city counterpart. Second, the demand-supply relationship can be grouped into a few clusters. Third, institutional barriers and development intensity produced significant but varying impacts, from either the supply or demand side, on the quality of public transit services. Inter-city collaboration and innovative transit solutions can advance the supply of regionalized transit services. Our research can help government officials, urban planners, and transit operators better solve the problems of transit services from a regional perspective.
表1 公共交通需求-供给关系类型识别指标说明及统计Tab. 1 Definition and statistics of identification indicators for the demand-supply relationship of public transit |
| 类型 | 指标 | 指标说明 | 平均值 | 标准差 |
|---|---|---|---|---|
| 职住空间联系特征 | 联系密度 | 18.01 | 83.05 | |
| 联系数量 | 职住联系人数 | 689.57 | 1,621.73 | |
| 联系相对强度 | 重力模型估计的理论与实际通勤规模对数的差 | 1.36 | 0.99 | |
| 联系距离 | 职住街道中心点直线距离 | 20.01 | 16.69 | |
| 公共交通服务特征 | 公交站点密度 | 职住街道的公交站点平均密度 | 4.31 | 2.90 |
| 线路靠站密度 | 职住街道的公交线路靠站平均密度 | 25.43 | 24.53 | |
| 线路网络密度 | 职住街道的公交线网平均密度 | 18.25 | 16.88 | |
| 路线绕行指数 | 1.31 | 0.35 | ||
| 路线换乘次数 | 职住街道最短时路线换乘次数 | 1.01 | 1.13 | |
| 路线直线速度 | 16.03 | 10.14 | ||
| 样本数量 | 14,775 | |||
表2 多元Logit模型自变量说明与描述性统计Tab. 2 Definition and descriptive statistics of independent variables in the multi-nominal Logit model |
| 指标 | 指标说明 | 单位 | 样本量(个)/ (平均值) | 占比(%)/(标准差) |
|---|---|---|---|---|
| 制度因素 | ||||
| 跨市联系 | 两街道是否属于同城 | - | ||
| 是 | 2785 | 19.80 | ||
| 否 | 11283 | 80.20 | ||
| 不跨市但跨界 | 两街道是否属同城但连接线跨行政边界 | - | ||
| 是 | 521 | 3.70 | ||
| 否 | 13547 | 96.30 | ||
| 开发强度 | ||||
| 道路密度(居住) | 居住地街道主干道密度 | km/km2 | (0.84) | (0.61) |
| 道路密度(工作) | 工作地街道主干道密度 | (0.85) | (0.66) | |
| 连线平均道路密度 | 职住连线上街道平均道路密度 | (0.85) | (0.39) | |
| 连线平均人口密度 | 职住连线上街道平均人口密度 | 万人/km2 | (0.98) | (0.83) |
| 社会经济属性 | ||||
| 二手房价格 | 居住地街道在售二手房均价(来源:房天下) | 万元/m2 | (3.19) | (1.96) |
| 平均受教育年限 | 居住地街道七普平均受教育年限 | 年 | (11.52) | (1.19) |
| 老年人口比例 | 居住地街道七普60岁及以上人口比例 | 百分点 | (10.34) | (6.08) |
| 青少年人口比例 | 居住地街道七普14岁及以下人口比例 | 百分点 | (14.75) | (3.20) |
| 性别比例 | 居住地街道七普人口男性/女性×100 | - | (114.63) | (13.99) |
| 样本数量(个) | 14068 | |||
表3 跨市与市内职住联系与公共交通服务特征对比Tab. 3 Comparing inter- and intra-city jobs-housing linkages and transit services |
| 类型 | 通勤人数占比 (%) | 通勤距离 (km) | 路线绕行指数 | 路线换乘次数 | 路线直线速度 (km/h) |
|---|---|---|---|---|---|
| 跨市 | 4.9 | 56.94 | 1.42 | 1.32 | 16.70 |
| 市内 | 95.1 | 6.47 | 1.18 | 0.31 | 10.46 |
| 珠三角均值 | 100.0 | 8.94 | 1.21 | 0.40 | 11.06 |
表4 公共交通需求-供给关系类型的特征指标均值Tab. 4 Mean values of indicators for the demand-supply relationship of public transit |
| 编号 | 类型名称 | 联系 密度 | 联系 数量 | 联系 相对强度 | 联系 距离 | 公交站点密度 | 线路靠站密度 | 线路网络密度 | 路线绕行指数 | 路线换乘次数 | 路线直线速度 |
|---|---|---|---|---|---|---|---|---|---|---|---|
| #1 | 高密度-短距离-优服务 | 129.70 | 519.44 | 0.05 | 5.27 | 9.80 | 77.21 | 52.51 | 1.20 | 0.19 | 10.43 |
| #2 | 低密度-长距离-需换乘 | 0.13 | 279.91 | 1.70 | 45.53 | 2.90 | 11.44 | 8.37 | 1.28 | 1.34 | 40.71 |
| #3 | 长距离-高绕行-多换乘 | 0.18 | 262.97 | 1.61 | 34.45 | 2.81 | 11.19 | 8.07 | 1.64 | 2.55 | 17.55 |
| #4 | 强需求-稀供给-低速度 | 2.22 | 1472.15 | 2.22 | 15.42 | 2.21 | 8.72 | 6.34 | 1.20 | 0.39 | 11.60 |
| #5 | 中密度-中距离-需换乘 | 10.31 | 400.62 | 0.73 | 12.77 | 5.77 | 36.51 | 27.08 | 1.24 | 0.76 | 14.31 |
表5 多元Logit模型结果的边际效应Tab. 5 Marginal effect of independent variables in the multi-nominal Logit model |
| 簇#1 | 簇#2 | 簇#3 | 簇#4 | 簇#5 | ||||||
|---|---|---|---|---|---|---|---|---|---|---|
| 高密度-短距离-优服务 | 低密度-长距离- 需换乘 | 长距离-高绕行- 多换乘 | 强需求-稀供给- 低速度 | 中密度-中距离- 需换乘 | ||||||
| 指标 | 边际值 | Z-值 | 边际值 | Z-值 | 边际值 | Z-值 | 边际值 | Z-值 | 边际值 | Z-值 |
| 制度因素 | ||||||||||
| 跨市联系(是) | -0.05 | -6.16** | 0.10 | 16.66** | 0.17 | 20.61** | -0.24 | -38.61** | 0.02 | 2.09* |
| 不跨市但跨界(是) | -0.01 | -0.84 | -0.04 | -4.76** | 0.15 | 9.81** | -0.09 | -7.68** | 0.00 | 0.01 |
| 开发强度 | ||||||||||
| 道路密度(居住) | 0.02 | 9.16** | -0.005 | -0.60 | -0.03 | -3.06** | -0.01 | -1.29 | 0.02 | 3.66** |
| 道路密度(工作) | 0.01 | 3.58** | 0.01 | 1.50 | -0.04 | -4.84** | -0.02 | -2.46* | 0.04 | 8.06** |
| 连线平均道路密度 | -0.03 | -5.63** | -0.06 | -4.37** | -0.02 | -1.15 | 0.05 | 3.03** | 0.07 | 5.93** |
| 连线平均人口密度 | 0.10 | 41.87** | -0.003 | -0.39 | 0.03 | 3.04** | -0.30 | -26.30** | 0.17 | 33.97** |
| 社会经济属性 | ||||||||||
| 二手房价格 | 0.01 | 4.92** | -0.01 | -4.93** | 0.01 | 2.20* | -0.01 | -2.82** | 0.01 | 2.27* |
| 平均受教育年限 | -0.02 | -7.65** | 0.002 | 0.64 | -0.02 | -4.00** | 0.01 | 1.32 | 0.03 | 6.36** |
| 老年人口比例 | 0.002 | 5.12** | -0.01 | -8.25** | -0.01 | -4.54** | 0.002 | 3.63** | 0.01 | 10.08** |
| 青少年人口比例 | -0.001 | -1.08 | -0.002 | -2.75** | 0.01 | 7.75** | 0.004 | 2.17* | -0.01 | -7.36** |
| 性别比例 | -0.002 | -10.83** | -0.001 | -3.99** | 0.002 | 3.78** | 0.0004 | 1.02 | 0.002 | 4.07** |
| 样本数量 | 14068 | |||||||||
| McFadden R2 | 0.43 | |||||||||
注:*和**分别表示边际值在0.1和0.01水平上显著。 |
感谢匿名评审专家的意见与付出,专家对本文概念厘清和结论梳理方面的修改意见,使本文获益匪浅。
| [1] |
吴旗韬, 张虹鸥, 叶玉瑶, 等. 基于交通可达性的港珠澳大桥时空压缩效应. 地理学报, 2012, 67(6): 723-732.
[
|
| [2] |
|
| [3] |
林雄斌, 杨家文, 丁川. 迈向更加可支付的机动性与住房: 公交导向开发及其公平效应的规划解析. 城市规划, 2018, 42(9): 118-126.
[
|
| [4] |
|
| [5] |
|
| [6] |
交通运输部. 交通运输部通知开展国家“公交都市”建设示范工程. https://www.gov.cn/gzdt/2011-11/29/content_2005516.htm, 2024-07-12.
[Ministry of Transport of the People's Republic of China. On Implementing National Transit Metropolis Pilot Project. https://www.gov.cn/gzdt/2011-11/29/content_2005516.htm, 2024-07-12.]
|
| [7] |
中华人民共和国国务院新闻办公室. 中国应对气候变化的政策与行动. https://www.gov.cn/zhengce/2021-10/27/content_5646697.htm, 2024-07-12.
[The Information Office of the State Council of the People's Republic of China. Responding to Climate Change: China's Policies and Actions. https://www.gov.cn/zhengce/2021-10/27/content_5646697.htm, 2024-07-12.]
|
| [8] |
|
| [9] |
陈舒婷, 李裕瑞, 潘玮, 等. 中国县域陆路交通优势度格局演化及经济效应. 地理学报, 2022, 77(8): 1937-1952.
[
|
| [10] |
苗毅, 戴特奇, 宋金平. 交通优势度内涵扩展与方法改进及应用: 以西藏自治区为例. 地理学报, 2023, 78(6): 1515-1529.
[
|
| [11] |
|
| [12] |
|
| [13] |
|
| [14] |
陈若宇, 周江评. 基于位置服务大数据的粤港澳大湾区通勤标度特征分析. 清华大学学报: 自然科学版, 2022, 62(7): 1195-1202.
[
|
| [15] |
钮心毅, 王垚, 刘嘉伟, 等. 基于跨城功能联系的上海都市圈空间结构研究. 城市规划学刊, 2018, (5): 80-87.
[
|
| [16] |
|
| [17] |
周华庆, 杨家文. 区域公共交通服务供给问题与策略. 城市交通, 2018, 16(1): 17-23.
[
|
| [18] |
|
| [19] |
汪伟全. 空气污染的跨域合作治理研究: 以北京地区为例. 公共管理学报, 2014, 11(1): 55-64.
[
|
| [20] |
吴康, 方创琳, 赵渺希, 等. 京津城际高速铁路影响下的跨城流动空间特征. 地理学报, 2013, 68(2): 159-174.
[
|
| [21] |
|
| [22] |
刘毅, 王云, 杨宇, 等. 粤港澳大湾区区域一体化及其互动关系. 地理学报, 2019, 74(12): 2455-2466.
[
|
| [23] |
林雄斌, 杨家文, 孙东波. 都市区跨市公共交通规划与空间协同发展: 理论、案例与反思. 经济地理, 2015, 35(9): 40-48.
[
|
| [24] |
周华庆, 林雄斌, 陈君娴, 等. 走向更有效率的合作: 都市区跨市巴士公交服务供给与治理. 城市发展研究, 2016, 23(2): 110-117.
[
|
| [25] |
|
| [26] |
塔娜, 柴彦威, 关美宝. 建成环境对北京市郊区居民工作日汽车出行的影响. 地理学报, 2015, 70(10): 1675-1685.
[
|
| [27] |
|
| [28] |
谢栋灿, 王德, 钟炜菁, 等. 上海市建成环境的评价与分析: 基于手机信令数据的探索. 城市规划, 2018, 42(10): 97-108, 120.
[
|
| [29] |
|
| [30] |
国家发改委. 国家发展改革委关于培育发展现代化都市圈的指导意见. https://www.gov.cn/xinwen/2019-02/21/content_5367465.htm, 2024-07-12.
[National Development and Reform Commission of the People's Republic of China. Guidelines on Cultivating and Developing Modern Metropolitan Areas from the National Development and Reform Commission. https://www.gov.cn/xinwen/2019-02/21/content_5367465.htm, 2024-07-12.]
|
| [31] |
|
| [32] |
|
| [33] |
|
| [34] |
|
| [35] |
|
| [36] |
|
| [37] |
|
/
| 〈 |
|
〉 |