
中国极端热事件的多维度演变模式研究
|
柯杰辉(2003-),男,广东茂名人,主要从事遥感图像处理和计算机视觉研究。E-mail: kejiehui03@gmail.com |
收稿日期: 2024-07-23
录用日期: 2024-11-23
网络出版日期: 2025-07-17
基金资助
国家自然科学基金项目(41801250)
国家自然科学基金项目(42071443)
广东乡村地域系统野外科学观测研究站项目(2021B1212050026)
Research on the multidimensional evolution patterns of extreme heat events in China
Received date: 2024-07-23
Accepted date: 2024-11-23
Online published: 2025-07-17
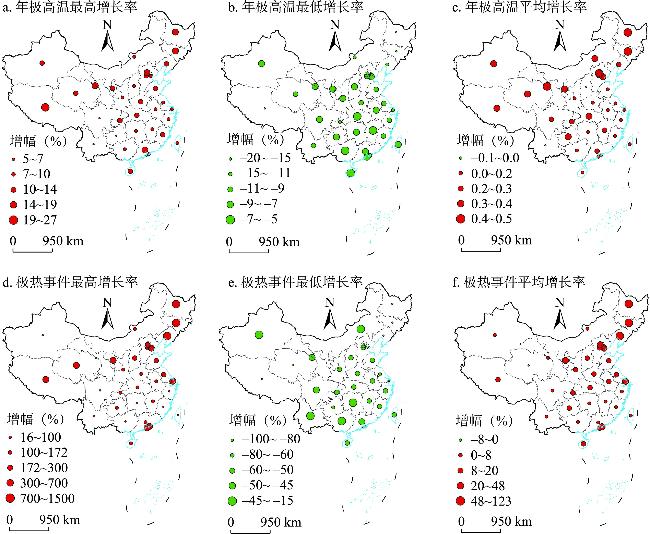
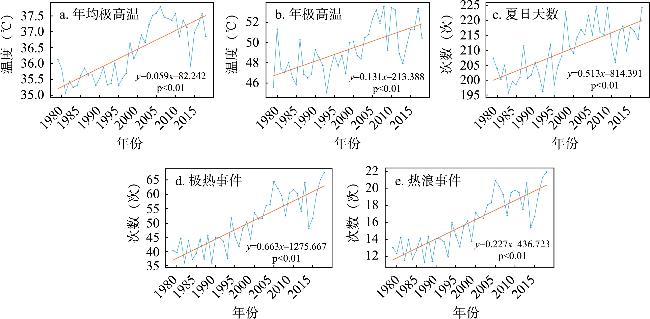
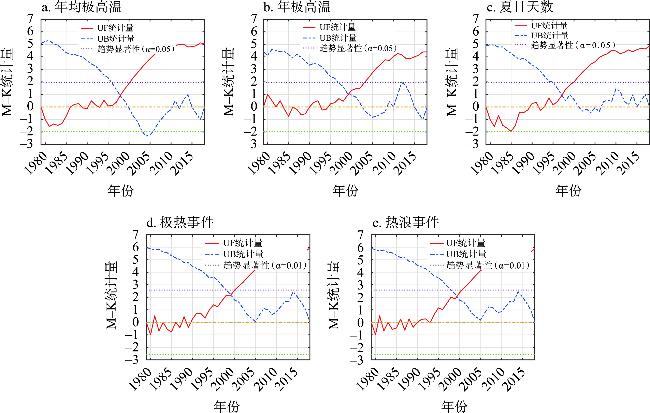
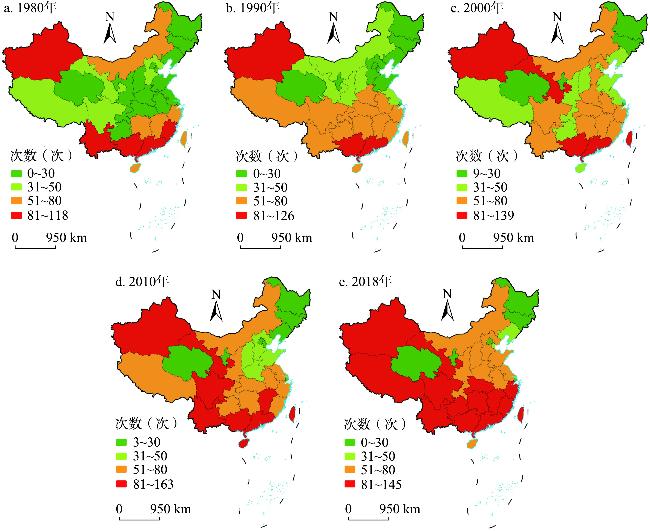
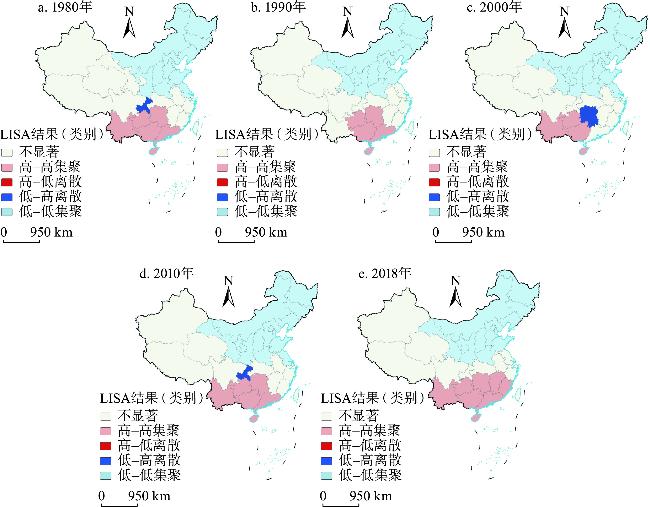
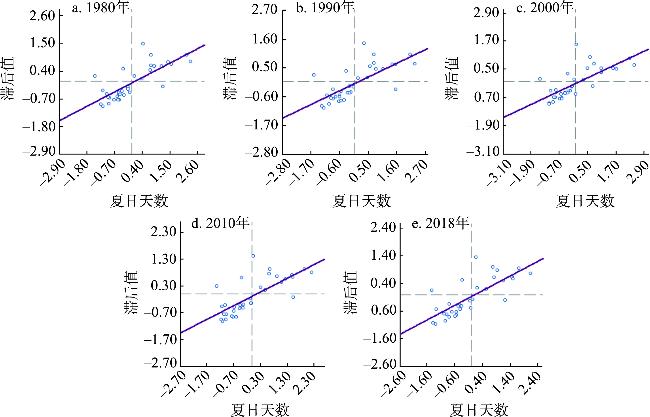
极端热事件对环境、农业、公共健康和社会经济可持续发展等有负面影响。深入理解其变化趋势、空间分布和驱动因素,可为应对气候变化提供科学依据。本文基于遥感技术和多种统计方法,使用中国1979—2018年逐日近地面气温数据和NCDC(美国国家气候数据中心)数据源,通过分析中国极端热事件相关指标,探讨中国极端热演变模式和温度上升的驱动因素。研究结果显示:全国范围内年极高温、年均极高温、夏日天数、热浪事件、极热事件等指标呈上升趋势,1997—1999年出现突变点。年极高温和极热事件省级增长率呈不均衡性。北京、重庆、甘肃等6个省份的年极高温增速超过全国平均水平。全国整体变暖趋势显著,极热事件地理分布范围扩大,夏日天数存在空间集聚性,范围逐渐扩展。Month(观测月份)和DPT(露点温度)对AT(空气温度)为显著正向影响,Hour(观测小时)、SLP(海平面气压)和SC(天空状况)对AT为显著负向影响。研究结论对未来研究全球气候变化、及可持续发展具有参考价值。
柯杰辉 , 何汶庭 , 黄炜强 , 骆仁波 . 中国极端热事件的多维度演变模式研究[J]. 地理研究, 2025 , 44(7) : 1755 -1769 . DOI: 10.11821/dlyj020240718
Extreme heat events have negative impact on the environment, agriculture, public health, and socio-economic sustainability. A comprehensive understanding of their trends, spatial distributions, and driving factors is crucial for providing scientific support to address climate change. This study, based on remote sensing techniques and various statistical methods, utilizes daily near-surface temperature data in China from 1979 to 2018, combined with data from the National Climatic Data Center. By analyzing indicators related to extreme heat events in China, we explore the evolution patterns of extreme heat events and the driving factors behind temperature rise. The results indicate that indicators such as annual extreme maximum temperature, annual average extreme maximum temperature, number of summer days, heatwave events, and severe heat events exhibit an overall increasing trend across the country, with a noticeable abrupt change occurring between 1997 and 1999. The provincial growth rates of annual extreme maximum temperature and severe heat events exhibit significant spatial heterogeneity. The increase in annual extreme maximum temperature in six provinces, including Beijing, Chongqing, and Gansu, exceeds the national average rate. A significant warming trend is observed across all provinces, accompanied by an expansion in the geographical range of severe heat events and an increase in spatial clustering of summer days. Observation month and DPT (dew point temperature) have a significant positive impact on AT (air temperature), while observation hour, SLP (sea level pressure), and SC (sky condition) have significant negative impacts. The conclusions of this study provide important insights for future research on global climate change and sustainability.
表1 极端热事件相关指标说明Tab. 1 Description of indicators related to extreme heat events |
| 指标名称 | 定义 | 单位 |
|---|---|---|
| 年极高温 | 全年年度单日最高温度 | ℃ |
| 年均极高温 | 全年每天最高气温的平均值 | ℃ |
| 夏日天数 | 全年单日最高气温≥25℃的次数 | 次 |
| 热浪事件 | 全年连续3天温度超过≥35℃的次数 | 次 |
| 极热事件 | 全年单日最高气温超过≥35℃的次数 | 次 |
表2 基于M-K检验的行政区年极高温增长趋势显著性与增速分析Tab. 2 Trend significance and growth rate analysis of annual extreme maximum temperature in administrative regions of China based on the M-K test |
| 行政区 | p值 | 趋势斜率 | 行政区 | p值 | 趋势斜率 |
|---|---|---|---|---|---|
| 安徽 | 0.008 | 0.043 | 北京 | 0.002 | 0.088 |
| 重庆 | 0.002 | 0.076 | 甘肃 | <0.001 | 0.111 |
| 贵州 | <0.001 | 0.073 | 江苏 | 0.001 | 0.052 |
| 澳门 | 0.026 | 0.024 | 吉林 | 0.020 | 0.078 |
| 内蒙古 | 0.004 | 0.070 | 宁夏 | <0.001 | 0.078 |
| 上海 | <0.001 | 0.077 | 青海 | 0.048 | 0.046 |
| 陕西 | <0.001 | 0.057 | 山西 | 0.020 | 0.042 |
| 台湾 | <0.001 | 0.087 | 四川 | 0.001 | 0.060 |
| 新疆 | <0.001 | 0.129 | 天津 | 0.037 | 0.047 |
| 西藏 | 0.002 | 0.070 | 浙江 | 0.019 | 0.037 |
| 海南 | 0.408 | 0.009 | 福建 | 0.258 | 0.011 |
| 广东 | 0.08 | 0.021 | 广西 | 0.187 | 0.021 |
| 河北 | 0.616 | 0.020 | 黑龙江 | 0.477 | 0.025 |
| 河南 | 0.060 | 0.037 | 香港 | 0.521 | 0.003 |
| 湖北 | <0.001 | 0.083 | 湖南 | 0.095 | 0.022 |
| 辽宁 | 0.632 | 0.027 | 江西 | 0.070 | 0.029 |
| 山东 | 0.462 | 0.015 | 云南 | 0.239 | 0.015 |
注:全国平均趋势斜率为0.060 |
表3 全局Moran's I分析结果Tab. 3 Global Moran's I analysis results |
| 年份 | 1980 | 1990 | 2000 | 2010 | 2018 | |
|---|---|---|---|---|---|---|
| 年极高温 | Moran's I | 0.073 | 0.040 | 0.185 | 0.149 | 0.112 |
| p | 0.46 | 0.605 | <0.01*** | <0.05** | <0.10* | |
| Z | 1.361 | 0.917 | 2.821 | 2.360 | 1.890 | |
| 热浪事件 | Moran's I | 0.126 | 0.207 | 0.025 | 0.203 | 0.118 |
| p | <0.10* | <0.01*** | 0.52 | <0.01*** | <0.10* | |
| Z | 1.947 | 2.945 | 0.300 | 2.880 | 1.839 | |
| 极热事件 | Moran's I | 0.132 | 0.214 | 0.031 | 0.203 | 0.118 |
| p | <0.10* | <0.01*** | 0.46 | <0.01*** | <0.10* | |
| Z | 2.022 | 3.031 | 0.776 | 2.883 | 1.836 | |
| 夏日天数 | Moran's I | 0.379 | 0.361 | 0.380 | 0.371 | 0.373 |
| p | <0.01*** | <0.01*** | <0.01*** | <0.01*** | <0.01*** | |
| Z | 5.064 | 4.859 | 5.083 | 4.951 | 4.970 |
注:*、**、***分别表示结果在90%、95%和99%的置信水平下达到显著性。 |
表4 回归模型系数及显著性检验结果Tab. 4 Regression model coefficients and significance test results |
| α=0.05 | Const (常量) | Year (观测年份) | Month | 观测日期(Day) | Hour | DPT | SLP | WD | WS | SC | LPD6HD (6小时降水深度) |
|---|---|---|---|---|---|---|---|---|---|---|---|
| Coefi(系数)(模型一) | 3119.108 | 0.161 | 1.145 | 0.006 | -1.604 | 0.649 | -0.330 | 0.031 | 0.286 | — | |
| Coefi (模型二) | 2610.489 | 0.092 | 0.762 | -0.006 | -0.711 | 0.722 | -0.266 | 0.036 | 0.296 | -3.803 | -0.075 |
| p | <0.001 | <0.001 | <0.001 | <0.001 | <0.001 | <0.001 | <0.001 | <0.001 | <0.001 | <0.001 | <0.001 |
注:模型公式:AT = Const + Coefi ∗ xi(9≤i≤11) |
真诚感谢两位匿名评审专家在论文评审过程中所付出的时间和精力。评审专家对行文梳理、结论精炼等方面的修改意见,使本文获益匪浅。本研究使用的关键数据来源于毛克彪团队提供的中国1979—2018年逐日近地面气温数据以及NCDC数据资源。数据的公开与共享为本文的气温变化分析奠定了重要的基础。特别感谢这些团队的支持,使本研究得以顺利开展。在此,向所有为本研究提供帮助的个人和机构表示诚挚的谢意。
| [1] |
|
| [2] |
World Meteorological Organization.WMO Statement on the State of the Global Climate in 2019. Geneva: World Meteorological Organization, 2020, WMO-No.1248: 6-7.
|
| [3] |
World Meteorological Organization.WMO Statement on the State of the Global Climate in 2023. Geneva: World Meteorological Organization, 2024, WMO-No.1347: 3-4.
|
| [4] |
|
| [5] |
|
| [6] |
|
| [7] |
|
| [8] |
|
| [9] |
周雅清, 任国玉. 中国1956—2008年极端气温事件变化特征分析. 气候与环境研究, 2010, 15(4): 405-417.
[
|
| [10] |
|
| [11] |
|
| [12] |
|
| [13] |
|
| [14] |
|
| [15] |
|
| [16] |
|
| [17] |
|
| [18] |
|
| [19] |
|
| [20] |
韦仕丽, 杨春艳, 韦垒, 等. 气候变暖背景下兴义市近60年气候变化特征分析. 农业灾害研究, 2024, 14(1): 222-224.
[
|
| [21] |
韩雪萌. 世界气象组织警告:小心极端气候变化. 金融时报, 2024-04-03( 8).
[
|
| [22] |
崔童, 孙林海, 张驰, 等. 2022年夏季中国极端高温事件特点及成因初探. 气象与环境科学, 2023, 46(3): 1-8.
[
|
| [23] |
|
| [24] |
|
| [25] |
|
| [26] |
赵宗慈, 罗勇, 黄建斌. 全球变暖和厄尔尼诺事件. 气候变化研究进展, 2023, 19(5): 663-666.
[
|
| [27] |
|
| [28] |
|
| [29] |
|
| [30] |
章静. 增暖背景下中国干旱变化及未来耕地暴露度研究. 南京: 南京信息工程大学硕士学位论文, 2022: 49-51.
[
|
| [31] |
魏思浩.1979—2100年中国寒区范围分布与变化及其对气候变化的响应. 兰州: 兰州大学硕士学位论文, 2023: 77-78.
[
|
| [32] |
卫仁娟, 潘妮, 钟馨, 等. 四川省极端高温干旱复合事件变化特征研究. 水文, 2024, 44(6): 60-67, 75.
[
|
| [33] |
郑小华, 娄盼星, 马永永. 1961—2018年陕西极端气温时空变化特征. 气象与环境学报, 2021, 37(3): 81-87.
[
|
| [34] |
董苗.1960—2015年银川城市热岛效应的变化特征及城市化对其的影响. 兰州: 西北师范大学硕士学位论文, 2017: 62-63.
[
|
| [35] |
|
| [36] |
|
| [37] |
|
| [38] |
|
| [39] |
罗鑫玥, 陈明星. 城镇化对气候变化影响的研究进展. 地球科学进展, 2019, 34(9): 984-997.
[
|
| [40] |
张海燕.21世纪中国高温人口暴露及其健康风险预估. 兰州: 西北师范大学硕士学位论文, 2023: 63-65.
[
|
/
| 〈 |
|
〉 |