

1 引言
遥感大数据的不断丰富为识别县城建成区提供了数据支撑。目前关于县城建成区的研究主要是基于政府的统计年鉴数据[10⇓-12],缺少对县城建成区的实体空间研究。早在 20 世纪末,周一星等就指出了使用行政地域区分城乡的种种弊端,并建立了“城市实体地域”的概念[13],近年来,长序列、多时相、时效性强的遥感大数据不断丰富,为城市实体空间的识别提供了数据支撑[14,15]。当前国内外学者主要使用夜间灯光数据[16,17]、土地利用数据[18,19]和不透水面数据[20,21]识别城市建成区,还有少量研究基于Google Earth卫星影像直接目视解译城市建成区[22,23]。以上几种遥感数据中,夜间灯光数据使用最为普遍,但存在空间分辨率不高的问题(DMSP/OLS为1km,NPP/VIIRS为500m)[24];基于遥感影像制备的土地利用数据和不透水面数据并无本质差别且空间分辨率较高(30 m),目前得到了越来越多研究者的应用[20,21,25];Google Earth卫星影像虽然精度更高,但因目视解译城市建成区工作量巨大且自动化程度低,主要集中在单个或几个城镇的研究。
由此,本研究参考城市实体地域的概念,研发基于不透水面数据的中国县城建成区边界识别技术流程,建立中国县城建成区边界数据集,进而揭示2010—2020年中国县城建成区的时空演化特征,以期为中国新型城镇化和乡村振兴战略提供科学参考。
2 研究方法
2.1 数据来源与处理
本研究所用数据主要包括不透水面、地形起伏度、县城社会经济统计和行政边界数据。具体地:① 不透水面数据采用的是中国科学院空天信息创新研究院刘良云团队生产的30 m×30 m空间分辨率的全球不透水面时空序列数据(Global 30 m Impervious Surface Dynamic dataset, GISD30),该数据集的总体精度为90.1%,Kappa系数为0.865,时间序列为1985—2020年,数据具有较高的可信度和时效性[26]。本研究选取2010年和2020年的GISD30数据识别中国县城建成区的边界。② 地形起伏度(Relief Degree of Land Surface, RDLS)数据来源于游珍等公开分享的中国1 km地形起伏度数据集[27]。地形起伏度是对区域海拔高度和地表切割程度的综合表征,本研究用该指标来探讨县城建设集中度与地形起伏度的关联性。③ 县城的数量与县级GDP数据来源于《中国县域统计年鉴(县市卷)》(2021年),在去除了一些县市同体的县级行政单元后(如河北省沧县的县城即在沧州市区内),本研究的县城单元共计1867个,包含388个县级市,1479个县(自治县)、旗(自治旗)和林区。县城建成区面积统计数据来源于《中国县城建设统计年鉴(2021)》。④ 县级行政边界数据来源于中国科学院资源环境科学数据中心(
2.2 县城建成区识别的技术方法
本研究采用不透水面数据识别中国县城建成区边界。识别县城建成区遵循以下3个原则:① 一致性原则。县城是县级人民政府的驻地,将与县城人民政府注记点重合的不透水面斑块识别为县城建成区。② 科学性原则。县城建成区的大小应该超过一定的阈值,本研究中将大于0.01 km2的斑块视为建成区潜在对象,然后综合专家知识和在线地图确定县城建成区边界。③ 差异化原则。对于不透水面无法识别的,如青藏高原的县城,使用Google Earth目视解译县城建成区。识别的过程包含4个步骤:首先(步骤1),提取中国范围内的不透水面斑块;然后(步骤2),确定研究县域单元数量并获取县城注记点;其次(步骤3),结合专家经验逐个解译2010年和2020年的中国县城不透水面边界;最后(步骤4),填补县城不透水面斑块的间隙确定县城建成区边界。图1为县城建成区识别的具体技术路线图。
图1
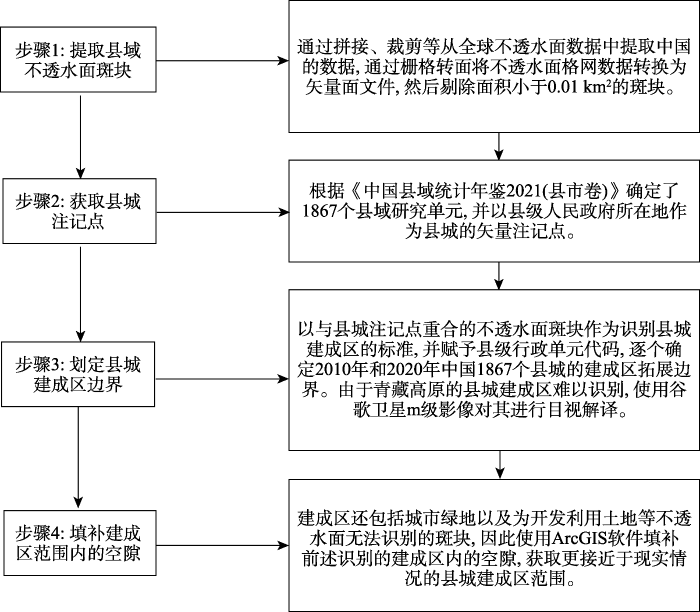
图1
中国县城建成区识别的技术路线
Fig. 1
Technical framework of built-up area in county towns of China
为检验本研究获取的县城建成区精度,另外获取了两套覆盖中国范围的城市拓展边界数据。第一套是欧盟发布的 1975—2030年每隔5年的1 km×1 km 空间分辨率的全球人类定居点数据集(Global Human Settlement Layer-SMOD)[28],第二套数据是Li等基于不透水面数据制作的1990年、1995年、2000年、2005年、2010年、2015年和2018年30 m×30 m分辨率的全球城市边界数据(Global Urban Boundaries,GUB)[20]。本研究使用上述2套数据对2020年的中国县城建成区边界进行精度验证。基于验证区代表性的考虑,分别选取中国人口相对密集的黄淮海平原(冀鲁豫交界)和人口相对稀疏的武陵山区(渝湘贵交界)的典型县城建成区作为案例区,从3套数据的空间分辨精度和统计年鉴上的县城建成区面积的误差两个层面进行精度交叉对比验证。
2.3 县城建成区演化的统计分析方法
2.3.1 核密度方法
借助核密度方法揭示中国县城建成区的空间集聚特征。核密度方法可以平滑地识别样本,并能够对样本中心强度进行递减传输,是一种刻画地理要素空间集聚和分散特征的非参数估计方法,充分体现了地理学第一定律的中心强度随距离衰减的特性[29]。由于核密度方法已经得到了较为广泛的应用,详细计算公式不做赘述。本研究通过ArcGIS软件中的“Kernel Density Estimation”工具实现。
2.3.2 重心模型和标准差椭圆方法
借助重心迁移模型和标准差椭圆方法实现对2010—2020年中国县城建成区时空演变的方向刻画。基于地理要素加权的重心模型可以描述地理要素的时空迁移规律,而标准差椭圆可以反映地理要素的分布情况和扩张方向,通常将二者结合起来研究较大空间尺度下地理要素的时空演变特征和迁移规律[30]。由于重心模型和标准差椭圆方法已经得到了较为广泛的应用,详细计算公式不做赘述。本研究通过ArcGIS软件中的“Mean Center”和“Standard Deviational Ellipse”工具实现。
2.3.3 县城建成区年均扩张强度指数
参考奥勇等[31]的研究,采用年均扩张强度指数表征县城建成区的综合扩张水平,计算公式为:
式中:Ii为第i个县城建成区扩张强度指数;An,i和An+j,i为第i个县城第n年和第n+j年的建成区面积;Si为第i个县域的土地总面积。
2.3.4 县城建设集中度指数
构建县城建设集中度指数,反映县城建设相对于县域建设的集中程度。其测算方法是计算县城建成区面积在整个县域建成区面积中的占比,具体公式如下:
式中:Bi为第i个县域的县城建设集中度指数;Ui为第i个县域的县城建成区面积;Ci为第i个县域的总建成区面积。
3 结果分析
3.1 县城建成区的识别精度验证
图2
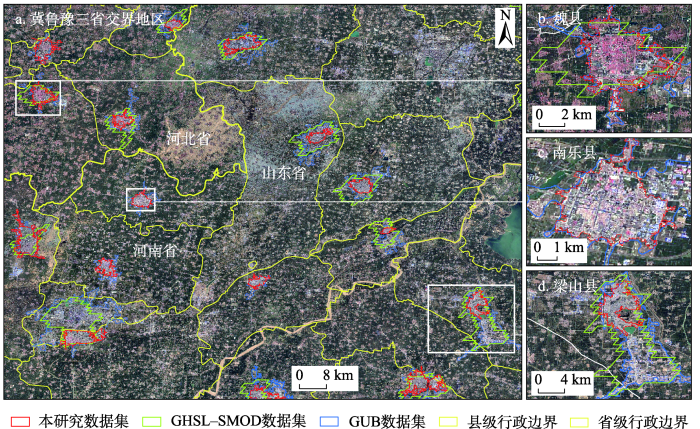
图2
本研究与GHSL-SMOD和GUB的对比(冀鲁豫三省交界,2020年)
注:底图截自2020年12月Google Earth卫星影像图。
Fig. 2
Comparison of this dataset with GHSL-SMOD and GUB (Border of Hebei, Shandong, and Henan, 2020)
对人口稀疏的武陵山区县城建成区的对比验证显示,本数据集的精度较高。选取重庆、湖南和贵州三省交界的典型县域验证数据精度(图3),总体来看,县城建成区边界数据集在山区的识别精度要低于平原地区,而本数据集依旧保持了较好的空间精细度。图3显示GHSL-SMOD未能识别出酉阳土家族苗族自治县和江口县的县城建成区边界,存在较为明显的遗漏问题。而GUB数据集精度较高,基本能够刻画案例县城的建成区边界,但未能很好地识别辰溪县河对岸的城区边界。相比之下,本研究结合不透水面数据和专家知识,首先通过县城注记点确定识别对象,并采用30 m分辨率的遥感影像产品识别县城建成区边界,可以有效避免遗漏的问题,提高了县城建成区识别的准确度。
图3
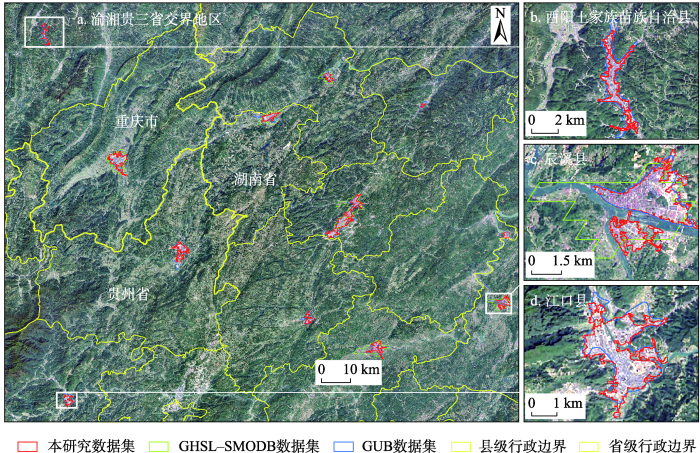
图3
本研究与GHSL-SMOD和GUB的对比(渝湘贵三省交界,2020年)
注:底图截自2020年12月Google Earth卫星影像图。
Fig. 3
Comparison of this dataset with GHSL-SMOD and GUB (Border of Chongqing, Hunan, and Guizhou, 2020)
本数据集获取的县城建成区面积更加接近统计年鉴的数值。分别统计了本研究、GHSL-SMOD和GUB得到的上述6个县域的县城建成区面积,并与《县城建设统计年鉴(2021)》里面6个县域的建成区面积进行精度验证(图4)。从缺失情况来看,GHSL-SMOD 数据集的缺失率最高,GUB和本数据集的缺失率为0。从误差大小来看,GHSL-SMOD 数据集主要表现为高估,得到的县城建成区面积全部高于统计年鉴的数据,而GUB数据集得到的县城建成区面积数据表现不稳定,在平原县城普遍高于统计年鉴的数据,在山区县城普遍低于统计年鉴的数据。本研究获取的县城建成区面积均低于统计年鉴的数据,这与使用不透水面核算建成区面积口径较窄有关。由于是从城市实体地域概念出发,本研究得到的县城建成区面积更加接近现实情况。
图4

图4
本研究、GHSL-SMOD和GUB统计的县城建成区面积与统计年鉴数据的对比
Fig. 4
Comparison of the county towns' built-up area of this dataset, GHSL-SMOD, GUB and statistical yearbook
3.2 县城建成区的时空演变分析
中国大部分县城建成区面积在10 km2以下,面积较大的县城主要集中在黄淮海平原、长三角、海峡西岸以及湘赣川省会都市圈。基于不透水面的统计数据显示(图5),中国大部分县域单元(1196个,占比为64.06%)的县城建成区面积小于10 km2。超过20 km2的县域单元有436个,占比为23.35%,主要为东部沿海以及中西部一些经济较为发达的县域。超过100 km2的县域单元有15个,其中11个为县级市,主要分布在江苏、浙江和福建等地,如江苏省江阴市,2020年县城建成区面积超过了100 km2。低于1 km2的县域单元有98个,占比约为5.25%,主要为青藏高原以及西北地区的一些县。从时间上来看,2010—2020年中国县城建成区面积不断扩张,形成了黄淮海平原和长三角两大热点地区,另外,中部的河南、湖南和江西以及西部的四川也形成了县城建成区增长次热点地区。
图5
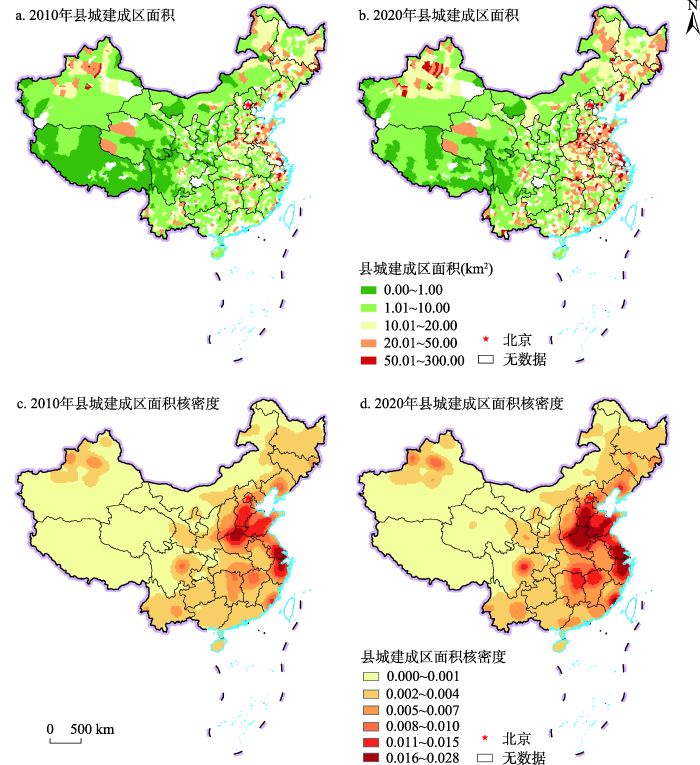
图5
2010年和2020年中国县城建成区面积及核密度
注:基于自然资源部地图技术审查中心标准地图服务网站的标准地图(审图号:GS(2019)1819号)绘制,底图边界无修改。为方便显示,
Fig. 5
Map showing the county towns' built-up area and kernel density in China in 2010 and 2020
2010—2020年,中国县城建成区的重心向西南方向迁移,集聚趋势增加明显。从标准差椭圆的重心来看(图6),2020年中国县城建成区的重心位于河南省禹州市(113.29N、34.09E),相对于中国地理几何中心位置偏东北方向,短轴和长轴之比为0.97,表明县城建成区的分布极化不明显,方位角为85.7°,接近90°垂直方向,表明中国县城建成区主要沿南北方向发展。2010—2020年重心向西南方向移动了40.81km,年均迁移4.08 km,表明过去10年中国西部和南部地区县城建成区面积增量相对更多,而椭圆的面积有所减小并向西南方向收缩,表明县城建成区向西南地区的集聚趋势增强。
图6
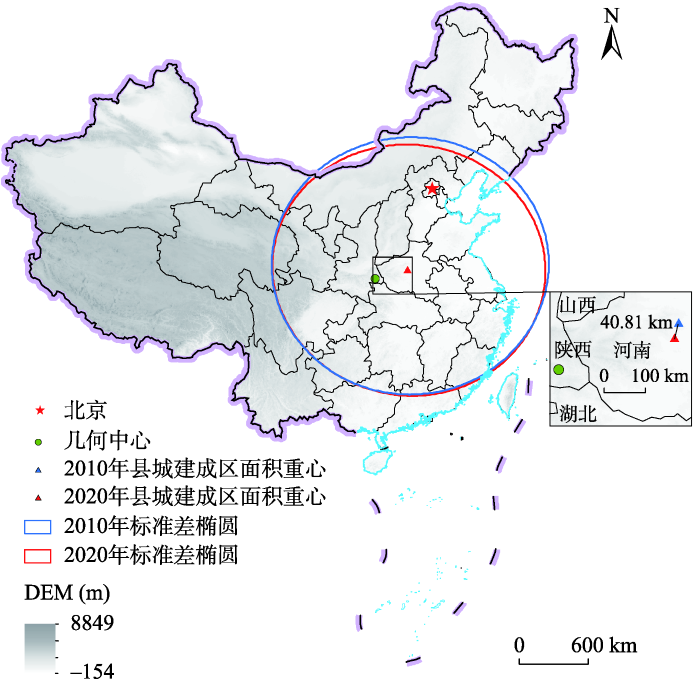
图6
2010年和2020年中国县城建成区面积重心与标准差椭圆
注:基于自然资源部地图技术审查中心标准地图服务网站的标准地图(审图号:GS(2019)1819号)绘制,底图边界无修改。
Fig. 6
Mean center and standard deviational ellipse of the county towns' built-up area in China in 2010 and 2020
2010—2020年,中国县城建成区扩张速度较快的县域主要集中在中西部省份,而扩张强度较高的地区以黄淮海平原、长三角、长江中游和成渝城市群为主(图7)。就县城建成区的扩张速度而言,2010—2020年年均扩张速度在10%(即10年间县城建成区面积增加一倍)以上的县域单元有213个,占比约为11.41%,以中西部地区的县域单元为主,尤其是西部省级行政单元交界的边缘地区。这一方面与中西部地区县城建成区面积的基数较小有关,即较小的面积增量往往能体现出较高的增速;另一方面与近年来国家加大了对中西部的政策支持力度有关,如脱贫攻坚时期对贫困地区采取了倾斜性的建设用地政策[32],推动了此类县城建成区的面积扩张。就融合了县域面积的县城建成区扩张强度而言,2010—2020年年均扩张强度在0.1%(即10年间扩张面积占县域土地面积1%)以上的县域有140个,约占总数的7.5%,主要集中在东部的河北、山东、江苏、浙江、福建,中部的河南、湖南、湖北、江西,以及西部的四川等省份,尤其以河南最为明显,比如郑州市区周边的中牟县,其在2010—2020年扩张的土地面积占县域面积的20%以上。相较而言,西部大部分省份扩张强度较低,这主要与西部县城建成区增量较小和县域土地面积较大有关。
图7
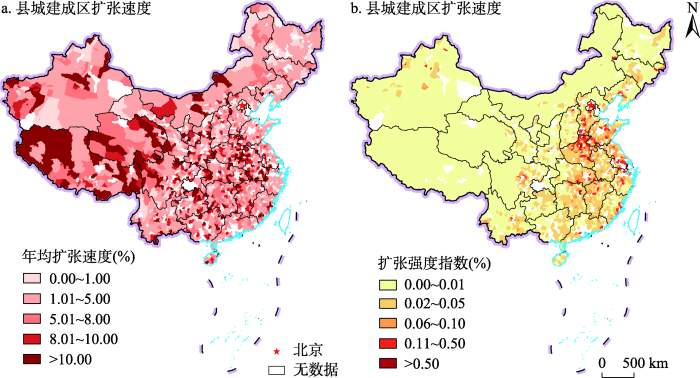
图7
2010—2020年中国县城建成区扩张速度和扩张强度
注:基于自然资源部地图技术审查中心标准地图服务网站的标准地图(审图号:GS(2019)1819号)绘制,底图边界无修改;为更好的显示效果,研究采取了县级行政区划展示县城建成区面积的地图表达形式。
Fig. 7
Map showing expansion rate and intensity of the county towns' built-up area in China from 2010 to 2020
3.3 县城建设集中度分析
县城建设集中度较高的县域主要分布在中西部地区,2010—2020年大部分县城占县域建成区占比增加(图8)。2020年,县城建设集中度高于30%的有345个县域单元,占比约为20.14%,主要分布在湖南、江西、山西、云南、贵州、陕西和新疆等中西部省区。而东部地区的县城建设集中度较低,大部分在20%以下。从时间上来看(表1),2010—2020年中国1713个县域中有1022个县城建设集中度上升,占比为59.66%,其中县城建设集中度增加10%以上的县域单元有60个,主要集中在中部地区的河南、湖北、湖南和江西,以及西部地区的新疆等省区。县城建设集中度减少5%以上的县域单元有144个,占比约为8.41%,主要集中在北方的山西、陕西和内蒙古等省区,多为人口净流出地区[33]。
图8
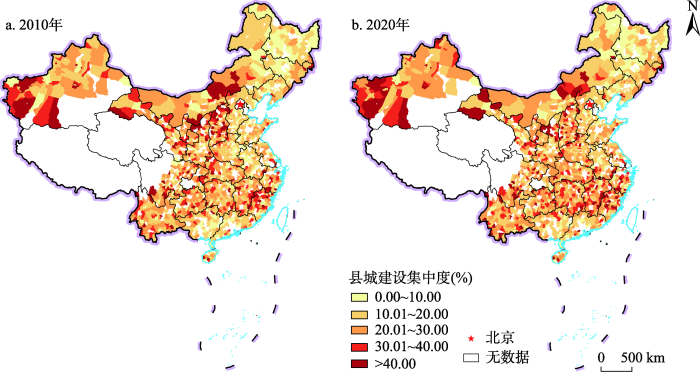
图8
2010年和2020年中国县城建设集中度
注:基于自然资源部地图技术审查中心标准地图服务网站的标准地图(审图号:GS(2019)1819号)绘制,底图边界无修改;为更好的显示效果,
Fig. 8
Map showing concentration of county towns construction in China in 2010 and 2020
表1 2010—2020年中国县城建设集中度变化
Tab. 1
| 变化幅度(%) | 数量(个) | 占比(%) |
|---|---|---|
| <-10 | 44 | 2.57 |
| -10~-5 | 100 | 5.84 |
| -5~0 | 547 | 31.93 |
| 0~5 | 761 | 44.42 |
| 5~10 | 201 | 11.73 |
| >10 | 60 | 3.50 |
县城建设集中度随着县域地形起伏度的提升而增加,且近年来呈现不断增强的趋势。在不同的地形起伏度分区下(表2):2020年,县域地形起伏度在0.2(相对高差为100 m)以下的县城建设集中度最低,仅为18.79%,而县域地形起伏度在1~2(相对高差为500~1000 m)的县城建设集中度最高,达到了25.14%,总体上,县城建设集中度随着县域地形起伏度的提升而增加。但当县域地形起伏度高于2时,县城建设集中度出现了下降,这些县城主要位于中国地形第一阶梯的边缘,是中国地形起伏最大的地区,县城建设受到地形的限制最为突出。从时间上看,2010—2020年县城建设集中度基本上呈现增加的态势,其中县域地形起伏度低于0.2时提升幅度最大,为2.49%。但县域地形起伏度在1~2的县城建设集中度有所下降,主要位于中国地形第二阶梯,县城建设受地形影响较大,表现为2010—2020年更多的建设用地扩张发生在县城范围以外。
表2 2010年和2020年不同地形起伏度分区下中国县城建设集中度统计
Tab. 2
| 地形 起伏度 | 县域数量(个) | 县城建设集中度及其增减变化(%) | ||
|---|---|---|---|---|
| 2010年 | 2020年 | 2010—2020年变化幅度 | ||
| 0~0.2 | 478 | 16.30 | 18.79 | 2.49 |
| 0.2~0.5 | 280 | 19.41 | 21.26 | 1.85 |
| 0.5~1 | 303 | 21.73 | 23.17 | 1.44 |
| 1~2 | 443 | 26.42 | 25.14 | -1.28 |
| >2 | 209 | 23.76 | 24.13 | 0.37 |
当人均GDP超过2万元时,县城建设集中度与县域经济发展水平呈现较强的正向关联,且近年来呈现不断增强的趋势。2020年(表3),县域人均GDP在8万~10万元时,县城建设集中度最高,达到了26.27%,而县域人均GDP在2万~4万元的县城建设集中度最低,仅为20.02%。总体上,当人均GDP超过2万元时,县域经济发展水平越高,县城建设集中度也越高,即较高的县域经济发展水平往往对应着较高的县城建设集中度。从时间上看,当人均GDP超过2万元时,2010—2020年县城建设集中度在不同经济发展水平的县域均有所增加,尤其是当县域人均GDP在2万~6万元时,其增加幅度最为明显,这表明当县域经济发展到一定程度,县城建设会出现明显的提速,县域经济发展水平与县城建设集中度表现为互促关系。
表3 2010和2020年不同经济发展水平下中国县城建设集中度统计
Tab. 3
| 2020年县域人均GDP (万元/人) | 县域数量(个) | 县城建设集中度及其增减变化(%) | ||
|---|---|---|---|---|
| 2010年 | 2020年 | 2010—2020年变化幅度 | ||
| <2 | 57 | 23.56 | 22.57 | -0.99 |
| 2~4 | 703 | 18.90 | 20.02 | 1.12 |
| 4~6 | 523 | 21.89 | 23.12 | 1.23 |
| 6~8 | 209 | 23.30 | 23.88 | 0.58 |
| 8~10 | 104 | 25.85 | 26.27 | 0.42 |
| >10 | 117 | 24.31 | 25.29 | 0.98 |
4 结论与讨论
4.1 结论
(1)本研究基于不透水面数据,提出了识别中国县城建成区边界的技术路线,建立了中国县城建成区数据库。将本研究构建的数据集与GHSL-SMOD和GUB数据集进行对比验证显示,无论是在人口密集的平原县域还是人口稀疏的山区县域,本研究识别的中国县城建成区扩张边界的空间精度均较高。进一步与统计年鉴上的县城建成区面积对比表明,本研究获得的县城建成区面积更加接近于政府统计数据。
(2)中国县城建成区面积较大的县域主要分布在黄淮海、长三角、海峡西岸和中西部省会都市圈,2010—2020年县城建成区扩张较快的县域主要集中于中西部省份。2020年,中国大部分县城建成区面积在10 km2以下,2010—2020年中国县城建成区面积的重心向西南方向移动,集聚趋势增强,增速较快的县域集中在中部和西部省份边缘地区。但就扩张的强度而言,2010—2020年扩张面积占县域土地面积1%以上的以东部和中部省份为主。
(3)县城建设集中度较高的县域主要集中在中西部地区,总体上与地形起伏度、经济发展水平呈正相关关系。县城建设集中度较高的县域集中在湖南、江西、山西、云南、贵州、陕西和新疆等中西部省区,2010—2020年约有6成县域的县城建设集中度增加。当地形起伏度小于2时,县城建设集中度受地形起伏度的约束明显,随着地形起伏度的提升而增加,且在2010—2020年趋势不断增强。当人均GDP超过2万元时,县城建设集中度与县域经济发展水平正向关联,县城建设集中度随着县域经济发展水平的提升而增加,且在2010—2020年趋势不断增强。
4.2 讨论
4.2.1 边际贡献
本研究的科学贡献体现为提出了一套使用遥感数据识别县城建成区边界的技术流程。相较于以往的研究,本研究结合30m分辨率的不透水面数据和专家经验方法识别了中国县城建成区边界,其空间精度明显高于单独采取不透水面数据的研究。同时,本研究兼顾了县城建成区识别的时间效率,能够在较短的时间内完成建成区的识别。另外,本研究首先确定了1867个研究单元并获取县城注记点,有效避免了县城建成区识别遗漏的问题。参考城市实体地域概念对不透水面数据的内部空隙进行了填充,获取了较为接近真实情况的县城建成区边界。
4.2.2 研究展望
本研究还有以下可待改进之处。首先,如何界定实体城市边界仍然是一个值得进一步探讨的问题。虽然本研究基于不透水面数据和专家知识为识别县城建成区边界提供了一种效率较高的思路,但学界当前对于如何确定实体城市的门槛阈值和边缘地带尚未形成统一认知,未来需要更多的理论探讨和实证研究。其次,本研究侧重于对县城建成区的时空演化特征研究,但未对县城建成区与其他要素的关联及其演化机制进行深入探讨,未来可考虑结合夜间灯光数据、人口格网数据等,以期更加深入地揭示县城建成区演化的内在机理。
致谢
真诚感谢匿名评审专家在论文评审中所付出的时间和精力,专家对本文研究综述、整体研究框架设计、结果分析、结论梳理方面的修改意见,使本文获益匪浅。
参考文献
推进以县城为重要载体的城镇化建设:新发展格局中的战略选择
Taking county town as the important carrier to promote urbanization: strategic choice in the new development pattern
县城在乡村城市化中的优势分析
On county town's advantage in rural urbaniazation
扎实推进以县城为重要载体的城镇化建设更好支撑城乡融合发展
Promote the urbanization construction with the county town as the important carrier to better support the development of urban-rural integrated development
中国县域城镇化发展格局及其影响因素: 基于2000和2010年全国人口普查分县数据
DOI:10.11821/dlxb201604007
[本文引用: 1]

利用2000 和2010 年中国人口普查分县数据,借助空间分析方法揭示近期中国常住人口城镇化格局特征及其动态变化,结合多元回归模型探讨城镇化空间分异的主要影响因素,基于主成分分析和聚类分析进行中国城镇化发展类型区划分。结果表明:① 2000-2010 年,中国常住人口城镇化率不断提高,年均增加1.3 个百分点,32%的县域城镇化水平年均增长超过1.5 个百分点;② 中国城镇化发展存在区域差异性和“低快高慢”的收敛性,东部、东北、中部、西部四大区域城镇化率年均分别增加1.4、0.5、1.4 和1.3 个百分点;③ 60%的中国县域城镇化发展集中在低城镇化率—高增长率、低城镇化率—中高增长率和低城镇化率—中增长率三种类型,且以中、西部地区分布最为密集;④ 中国县域城镇化格局基本未变,仍以珠三角、长三角、京津冀三大增长极的城镇化发展较为突出,东部地区及内陆省会城市周边的城镇化水平也相对较高;⑤ 经济发展水平、产业结构特征、人力资本状况、人口集聚能力、公共服务水平、地理区位特征对县域城镇化空间分异具有显著而稳健的影响;⑥ 中国城镇化格局可分为具有明显区类一致性和区外异质性的5 大类、20 个区域。新时期的城镇化发展应凸显地域功能、提升承载能力、夯实产业基础、强调节约集约。
Spatial pattern and influencing factors of urbanization development in China at county level: A quantitative analysis based on 2000 and 2010 census data
四川省县域城乡融合发展研究
Research on the development of urban and rural integration in Sichuan province
县域、县城与乡村振兴
County, city and rural vitalization
县城: 新时代中国城镇化转型升级的关键空间布局
County town: the key spatial layout of china's urbanization transformation and upgrading in the new era.
我国县城分类建设发展思路
Thinking of classified construction and development of county towns in China
以县城为重要载体的城镇化: 逻辑、约束与路径
Urbanization with county town as an important carrier: Logic, constraints and path
以县城城镇化推动县域经济高质量发展
Promote the high-quality development of the county economy with county towns' urbanization
依托县城发展农村城镇化与县域经济
Relying on the county towns to develop rural urbanization and county economy
基于DEA方法的县城可持续发展评价
Sustainable development evalution of counties in Hebei based on DEA
建立中国城市的实体地域概念
DOI:10.11821/xb199504001
[本文引用: 1]
本文总结了我国在城市的行政地域与景观地域严重背离的情况下,继续使用行政地域区分城乡的种种弊端,认为解决这一问题的关键在于建立适合中国特点又具有国际可比性的城市实体地域概念,以此作为城乡划分及统计的地域基础,文章提出以下限人口规模、非农化水平和人口密度三个指标定义城市实体地域,并在大量实证研究的基础上,通过对中国城市空间形态的分类,提出了一套完整的划分实体地域的方法和工作程序。
Toward establishing the concept of physical urban area in China
It is generally agreed that human settlements are classified either as urban places or as rural places,In urban studies,one has to deal with the relerant materials in the right way so as to reflect the reality of urban area.Urban areas may be conceived as administrative, functional and physical entities. This paper make a detailed analysis on the various drawbacks of the continued use of adiministrative area in the division of urban and rural area in spite of the serious discrepancies between urban administrative boundaries and the real’ urban space in China, Almost the administrative area of all cities and towns are much larger than the urban built-up area. As a result, vast rural areas and large agricultural population were included in the urban count. Here lies the principal difference with western countries. Obviously, it is difficult if not impossible for us to solve the contradiction by reducing the adiministrative area of a city or town. The authors believe that to solve this problem, it is essential to establish the concept of physical urban area with both adaptability to Chinese conditions and international comparability and make it the basis of urban-rural division and statistics.It is proposed that physical urban area in China can be delimitated in terms of three criteria,prescribed minimum population scale, degree of nonagricuturalization and population density, and the names of citied area or townized area can be given as the counterpart of urbanized area in the United States.The administrative area of a city or town in China consists of two parts: urban district and suburban area. The combination of the two parts is very conplex. For this reason, the key to put our scheme into effect is the classification of types according to the different relations between the two parts.Based on extensive research, the authors find that three factors bring about twelve types. AIa and AIb of them are the most basic types,All these types have their own quantitative standards.After understanding these types, the delineation of the physical urban areas become fairly easy according to the flow diagram(Fig.1).Eleven samples, except one type which is not find,are cited in this paper (Fig.2).
Using satellite imagery to understand and promote sustainable development
High-spatiotemporal-resolution mapping of global urban change from 1985 to 2015
A technique for using composite DMSP/OLS "City Lights" satellite data to map urban area
Research on large-scale urban shrinkage and expansion in the Yellow River affected area using night light data
As the land use issue, caused by urban shrinkage in China, is becoming more and more prominent, research on urban shrinkage and expansion has become particularly challenging and urgent. Based on the points of interest (POI) data, this paper redefines the scope, quantity, and area of natural cities by using threshold methods, which accurately identify the shrinkage and expansion of cities in the Yellow River affected area using night light data in 2013 and 2018. The results show that: (1) there are 3130 natural cities (48,118.75 km2) in the Yellow River affected area, including 604 shrinking cities (8407.50 km2) and 2165 expanding cities (32,972.75 km2). (2) The spatial distributions of shrinking and expanding cities are quite different. The shrinking cities are mainly located in the upper Yellow River affected area, except for the administrative cities of Lanzhou and Yinchuan; the expanding cities are mainly distributed in the middle and lower Yellow River affected area, and the administrative cities of Lanzhou and Yinchuan. (3) Shrinking and expanding cities are typically smaller cities. The research results provide a quick data supported approach for regional urban planning and land use management, for when regional and central governments formulate the outlines of urban development monitoring and regional planning.
中国省域人口空间结构特征及其对经济绩效的影响: 基于实体城市的空间识别
DOI:10.13249/j.cnki.sgs.2021.11.002
[本文引用: 1]
基于LandScan全球人口和ESA全球土地利用数据,构建2000—2015年中国省域人口空间结构数据库,刻画省域人口空间结构的时空格局,进而运用面板固定效应法、两阶段最小二乘法和差分GMM法探索空间结构对省域经济绩效的影响及这种影响对不同规模省域的差异,最后从省会城市集聚(不)经济的角度分析其内在机制。结果发现:① 2000—2015年,中国所有省会城市的人口规模都得到了显著增加,省域人口空间结构存在单中心化的演变趋势,且中西部地区省域人口空间结构相对偏单中心化;② 对所有省份尤其是人口规模相对较小的省份而言,人口空间结构单中心化倾向于提高省域经济效率,而对人口规模相对大的省份,人口空间结构单中心化很可能不利于省域经济效率的提高;③ 省会城市自身已经初显集聚不经济的迹象。
Characteristics and impact of population spatial structure on economic performance in China based on spatial identification of physical cities
Based on the global population data from LandScan and land use data released by the European Space Agency, this paper identifies physical urban areas and extracts their populations. On this basis, we constructed a database of the population’s spatial structure of China’s provinces for 2000-2015 and analyzed the spatial and temporal patterns of provincial population spatial structure. Further, this paper uses fixed panel, two-stage least square method and difference GMM method to investigate the effect of population spatial structure on provincial economic performance, and how this effect varies across different sizes. We also probe the underlying mechanisms from the perspective of the agglomeration (dis) economy of the provincial capital. The following findings were reached. First, during the period 2000-2015, the population size of all provincial capitals in China has increased significantly. In terms of the spatial structure index, the temporal evolution of China’s provincial population spatial structure is relatively modest, with a tendency towards monocentricity; in the central and western regions, the provincial population spatial structure is relatively monocentric, while in the eastern coastal regions the population spatial structure tends to be polycentric. Second, for all provinces, especially those with relatively small populations, a monocentric population spatial structure facilitates economic efficiency throughout the province. Third, judging from the economic development of the provincial capital cities themselves, China’s capital cities have entered the stage of agglomeration diseconomy, while considering the economic development of the whole province, the provincial capital cities have a clear boosting effect.
A new urban landscape in East-Southeast Asia, 2000-2010
Mapping global urban boundaries from the global artificial impervious area (GAIA) data
Urban boundaries, an essential property of cities, are widely used in many urban studies. However, extracting urban boundaries from satellite images is still a great challenge, especially at a global scale and a fine resolution. In this study, we developed an automatic delineation framework to generate a multi-temporal dataset of global urban boundaries (GUB) using 30 m global artificial impervious area (GAIA) data. First, we delineated an initial urban boundary by filling inner non-urban areas of each city. A kernel density estimation approach and cellular-automata based urban growth modeling were jointly used in this step. Second, we improved the initial urban boundaries around urban fringe areas, using a morphological approach by dilating and eroding the derived urban extent. We implemented this delineation on the Google Earth Engine platform and generated a 30 m resolution global urban boundary dataset in seven representative years (i.e. 1990, 1995, 2000, 2005, 2010, 2015, and 2018). Our extracted urban boundaries show a good agreement with results derived from nighttime light data and human interpretation, and they can well delineate the urban extent of cities when compared with high-resolution Google Earth images. The total area of 65 582 GUBs, each of which exceeds 1 km2, is 809 664 km2 in 2018. The impervious surface areas account for approximately 60% of the total. From 1990 to 2018, the proportion of impervious areas in delineated boundaries increased from 53% to 60%, suggesting a compact urban growth over the past decades. We found that the United States has the highest per capita urban area (i.e. more than 900 m2) among the top 10 most urbanized nations in 2018. This dataset provides a physical boundary of urban areas that can be used to study the impact of urbanization on food security, biodiversity, climate change, and urban health. The GUB dataset can be accessed from http://data.ess.tsinghua.edu.cn.
Landsat卫星观测下的30 m全球不透水面年度动态与城市扩张模式(1972—2019)
30 m global impervious surface area dynamics and urban expansion pattern observed by Landsat satellites: From 1972 to 2019
基于Google高分历史影像的楚雄市东南新城土地利用动态与景观格局分析
Land use dynamics and landscape pattern analysis of Southeast new town in Chuxiong city based on google high resolution historical image
基于夜晚灯光数据和Google Earth的城市建成区提取分析
DOI:10.3724/SP.J.1047.2015.00750
[本文引用: 1]
夜晚灯光数据已被广泛应用于提取城市建成区的研究,由于灯光具有溢出特性,因此确定最佳灯光阈值成为研究热点。本研究中总结4种常用最佳阈值确定方法的特点,并使用Google Earth影像空间比较法,确定夜晚灯光数据提取城市建成区的最佳阈值。由于地形、交通等因素影响城市形态,城市形态影响夜晚灯光数据提取城市建成区的最佳阈值大小,因此,根据城市形态将阈值结果分为2类,并得到块状城市和带状城市建成区的最佳灯光阈值分别为43和 47。Google Earth影像空间比较法与其他方法相比具有不受统计数据限制,以及简易操作等优势,且从形态上对城市建成区提取结果进行空间比较;其次,根据城市形态对最佳阈值结果分类,使不同类型的城市建成区提取结果更准确。该方法适用于在地形复杂、形态多样的大尺度空间中提取城市建成区。
A method of extracting urban built-up area based on DMSP/OLS nighttime data and Google Earth
夜间灯光遥感与城市问题研究:数据、方法、应用和展望
Nighttime light remote sensing and urban studies:Data,methods,applications, and prospects
1988—2018年中国城市实体地域与行政地域用地扩张对比
DOI:10.11821/dlxb202210007
[本文引用: 1]
城市边界是城市演化认知和城市规划决策的空间依据。中国不少研究实践将地级市等行政地域范围视为城市,与物理上主要由连续人造不透水面构成的城市实体地域相比,存在较大的空间边界差异。然而,鲜有研究定量分析“实体”视角下长时间序列的城市用地演化,特别是对实体和行政两种统计单元视角下的城市扩张差异缺乏系统认识。本文基于30 m空间分辨率的多源遥感产品识别了1988—2018年8期的城市实体地域边界,分析其用地扩张过程,进一步与行政地域相对比,系统识别了两种统计视角下城市用地扩张的认知差异和空间模式。主要结论为:① 1988—2018年间,中国面积5 km<sup>2</sup>以上的城市实体地域单元数量增长了378%,以华东和华中地区的增长最为显著;城市实体地域中,88%为独立增长型,分布广泛但面积大都小于50 km<sup>2</sup>;12%为空间聚合型,主要分布在发达地区,面积普遍较大。② 相比行政地域,城市实体地域的位序规模更符合幂律分布,其Zipf指数30年来逐渐上升趋向于1,城镇体系发展愈发均衡;相比城市实体地域,行政地域单元在平原地区的城市扩张面积普遍偏高,在沿海地区的城市扩张强度普遍偏低。③ 和城市实体地域单元在拓扑关系上无法一一匹配的1327个行政单元大多分布在人口密集或发达的平原地区;结合实体和行政边界识别了“跨政区同城化”和“政区内集群化”两种扩张模式,前者多发生在省会区域,后者主要分布在华北平原,两者反映了城市化的空间重构。本文研究结果有助于深化中国土地城镇化时空过程的认识,并可对土地资源的科学配置、统一协调及行政区划的优化整合提供空间依据。
Comparison of urban land expansion between urban physical and administrative areas in China from 1988 to 2018
Urban boundaries are the spatial basis for the cognition of urban evolution and urban planning decision-making. In China, "city" usually refers to a legally defined administrative unit, whose spatial boundary does not coincide with that of physical entity consisting of a continuous artificial impervious surface. However, few studies quantitatively analyze the temporal and spatial evolution of urban physical areas over long time series, especially lacking a systematic understanding of the spatial differences in urban land expansion from the views of physical and administrative areas. Based on the multi-source remote sensing products with a spatial resolution of 30 meters, we identified the physical urban boundary from 1988 to 2018 and analyzed the land expansion process of the physical area. Further, we identified the cognitive differences and spatial patterns of urban land expansion from the above two views and found the following conclusions: (1) In the past 30 years, the number of urban physcial areas in China with an area of more than five square kilometers has increased by 378%, and the most significant growth is in East and Central China. Among the physical areas, 88% of them belong to the type of "independent growth" widely distributed but most of them are smaller than 50 km2, while the other 12% belongs to the type of "spatial aggregation", mainly distributed in developed areas and the area is generally large. (2) Compared to administrative units, the rank-size distribution of urban area is more complying with the power-law model. Its Zipf's exponent has gradually increased to 1 in the past 30 years, indicating development of the urban system has become more and more balanced. Compared to physical areas, administrative area have larger land expansion area in plain areas and lower land expansion intensity in coastal areas. (3) The 1327 county-level administrative units that cannot topologically match the urban physical area are mostly distributed in densely populated or developed plain areas. Combining two views, two types of spatial expansion have been further identified, namely "inter-districts co-urbanization" and "intra-district clustering". The former occurs in provincial capital area, while the latter is mainly distributed in the developed areas of the North China Plain. Both reflect the spatial reconstruction of urbanization. This research is helpful to deepen the understanding of the spatiotemporal process of China's land urbanization and provide decision support for scientific land resource management.
GISD30: global 30 m impervious-surface dynamic dataset from 1985 to 2020 using time-series Landsat imagery on the Google Earth Engine platform
. Accurately mapping impervious-surface dynamics has great scientific\nsignificance and application value for research on urban sustainable development, the assessment of anthropogenic carbon emissions and global ecological-environment modeling. In this study, a novel and automatic method of\ncombining the advantages of spectral-generalization and automatic-sample-extraction strategies was proposed, and then an accurate global 30 m impervious-surface dynamic dataset (GISD30) for 1985 to 2020 was produced using\ntime-series Landsat imagery on the Google Earth Engine cloud computing\nplatform. Firstly, the global training samples and corresponding reflectance\nspectra were automatically derived from prior global 30 m land-cover\nproducts after employing the multitemporal compositing method and relative\nradiometric normalization. Then, spatiotemporal adaptive classification\nmodels, trained with the migrated reflectance spectra of impervious surfaces\nfrom 2020 and transferred pervious-surface samples in each epoch for every\n5∘×5∘ geographical tile, were applied to map\nthe impervious surface in each period. Furthermore, a spatiotemporal-consistency correction method was presented to minimize the effects of\nindependent classification errors and improve the spatiotemporal consistency\nof impervious-surface dynamics. Our global 30 m impervious-surface dynamic\nmodel achieved an overall accuracy of 90.1 % and a kappa coefficient of\n0.865 using 23 322 global time-series validation samples. Cross-comparisons\nwith five existing global 30 m impervious-surface products further indicated\nthat our GISD30 dynamic product achieved the best performance in capturing\nthe spatial distributions and spatiotemporal dynamics of impervious surfaces\nin various impervious landscapes. The statistical results indicated that the\nglobal impervious surface has doubled in the past 35 years, from\n5.116×105 km2 in 1985 to 10.871×10⁵ km2 in 2020, and Asia saw the largest increase in impervious surface area compared to other continents, with a total increase of 2.946×10⁵ km2. Therefore, it was concluded that our global 30 m\nimpervious-surface dynamic dataset is an accurate and promising product and\ncould provide vital support in monitoring regional or global urbanization as\nwell as in related applications. The global 30 m impervious-surface dynamic\ndataset from 1985 to 2020 generated in this paper is free to access at\nhttps://doi.org/10.5281/zenodo.5220816 (Liu et al.,\n2021b).\n
中国1km地形起伏度数据集
Relief Degree of Land Surface Dataset of China (1 km)
Principles and Applications of the Global Human Settlement Layer as Baseline for the Land Use Efficiency Indicator: SDG 11.3.1
The Global Human Settlement Layer (GHSL) produces new global spatial information, evidence-based analytics describing the human presence on the planet that is based mainly on two quantitative factors: (i) the spatial distribution (density) of built-up structures and (ii) the spatial distribution (density) of resident people. Both of the factors are observed in the long-term temporal domain and per unit area, in order to support the analysis of the trends and indicators for monitoring the implementation of the 2030 Development Agenda and the related thematic agreements. The GHSL uses various input data, including global, multi-temporal archives of high-resolution satellite imagery, census data, and volunteered geographic information. In this paper, we present a global estimate for the Land Use Efficiency (LUE) indicator—SDG 11.3.1, for circa 10,000 urban centers, calculating the ratio of land consumption rate to population growth rate between 1990 and 2015. In addition, we analyze the characteristics of the GHSL information to demonstrate how the original frameworks of data (gridded GHSL data) and tools (GHSL tools suite), developed from Earth Observation and integrated with census information, could support Sustainable Development Goals monitoring. In particular, we demonstrate the potential of gridded, open and free, local yet globally consistent, multi-temporal data in filling the data gap for Sustainable Development Goal 11. The results of our research demonstrate that there is potential to raise SDG 11.3.1 from a Tier II classification (manifesting unavailability of data) to a Tier I, as GHSL provides a global baseline for the essential variables called by the SDG 11.3.1 metadata.
中国城市公共健康水平的时空演化及其影响因素
DOI:10.11821/dlyj020210440
[本文引用: 1]
采用定基极差熵权法与定基等权赋值法相结合的综合评价方法、核密度估计、探索性空间数据分析等方法,分析2003—2018年中国284个地级以上城市公共健康水平的时空演化特征,并运用广义空间两阶段最小二乘法考察其影响因素。结果发现:① 研究期内中国城市公共健康水平整体呈上升趋势,但各城市间公共健康水平差异有所扩大,且始终存在多级分化现象;② 四大板块核密度曲线在重心位置、主峰高度、波峰数量、拖尾长度、拖尾厚度上均有各自演化形态,是一种时段特征与地区特色相互耦合叠加的结果;③ 中国城市公共健康水平存在正向空间溢出效应和空间“同群效应”,空间集聚类型实现了由LL型为主体向HH型为主体的转化;④ 收入水平、人口密度、科技进步、工业化程度、卫生体制改革对城市公共健康具有影响,但各因素对不同区域的影响存在异质性。
Spatio-temporal evolution and influencing factors of urban public health level in China
Based on the comprehensive evaluation method combining fixed base range entropy weight method and fixed base equal weight assignment method, kernel density estimation and exploratory spatial data analysis methods, this paper analyzes the spatio-temporal evolution characteristics of public health level of 284 cities in China from 2003 to 2018, and uses the generalized spatial two-stage least square method to investigate its influencing factors. The results show that: (1) During the study period, the urban public health level is on the rise as a whole in China, but the difference of public health level among cities has expanded, and there is always a phenomenon of multi-level differentiation. (2) The kernel density curves of the four plates have their own evolution forms in the position of gravity center, the height of main peak, the number of wave crests, the length of trailing and the thickness of trailing, which is the result of the coupling and superposition of time characteristics and regional characteristics. (3) There are positive spatial spillover effect and spatial “Peer Effects” in China's urban public health level, and the spatial agglomeration type has transformed from LL type to HH type. (4) Income level, population density, technological progress, industrialization and health system reform have an impact on urban public health, but the impact of various factors on different regions is heterogeneous.
中国城市分布特征及其影响因素
DOI:10.11821/dlyj201507014
[本文引用: 1]
通过对221 BC-1911 AD年间中国城市分布特征及其影响因素的研究,发现:① 在整个研究阶段,中国城市分布的重心位于中东部地区,秦—唐时期重心向西南地区大幅移动,唐—元时期重心先东北方向移动后转向西南方向,元—清时期重心主要向北移动。以腾冲—瑷珲一线为界线分区研究发现,在整个研究阶段西部重心在南北及东西方向呈现出较大的波动趋势,东部重心呈现出与全国类似的运动轨迹。② 标准差椭圆分析表明全国及东西部地区城市分布经历了明显的分散—集聚—分散的变化趋势,其中西部地区最为明显。从城市分布的平均方向看,全国及东部地区具有一定的相似性,均以东北—西南为主要分布特征,西部地区是以西北—东南为主要分布特征。③ 从城市密度分布特征看,其空间连续性和自组织性不断加强且由空间相关性引起的结构性变异处于显著状态。从方向上来看,全方向上的均质化程度呈下降趋势,西北—东南方向各时期城市密度均质化程度相对较好,空间差异相对较小,而东—西方向差异最为明显。④ 分析不同时期城市设置的相关因素发现,221 BC-1911 AD年间,中国城市设置相对集中在地形平坦、气候适中且靠近河流及中心城市的地区。
The distribution of cities in China and its influencing factors
This paper aims to examine the distribution of cities in China during 221 BC-1911 AD and its influencing factors. Some conclusions can be drawn as follows: (1) the urban distribution gravity center of China during the entire study stage was located in the central and eastern regions and firstly, moved sharply southwestward from the Qin dynasty to the Tang dynasty. Secondly, the gravity center moved toward the northeast from the Tang dynasty to the Yuan dynasty, and then toward the southwest direction. Finally, the gravity center during the Yuan-Qing dynasty moved mainly towards the north direction. In this paper, we divided China into east and west parts by the population line of Tengchong-Aihui and found that during the study period, the gravity center path in the western region presented a large fluctuation trend in both the south-north and the east-west directions. However, the moving trajectory of the gravity center in the eastern region was similar to that of the whole country. (2) The analyses of the standard deviational ellipses showed that the urban distribution in the whole country, the eastern region, and the western region exhibited a distribution pattern of "decentralization, centralization and decentralization", and this trend in the western region was most obvious. From the perspective of the average direction, the urban distribution in the whole country and the eastern region were similar to a certain degree, with the northeast-southwest as the main characteristics. However, the urban distribution in the western region took the northwest-southeast as the main features. (3) Based on the urban density distribution and spatial correlation, we found that its spatial continuity and self-organization were continuously strengthened, and the structural variation was in a significant state. Viewing from the direction, we concluded that the degree of homogenization on the Omni-direction tended to decline. The urban density homogenization degree of each dynasty in the northwest and southeast directions was relatively good and the spatial differences were minimal, but the spatial differences in the east and west directions were most obvious. (4) The analysis of the related factors of the urban setting up in different periods revealed that the setting up of the cities of China during 221 BC-1911 AD mainly focused on the flat terrain near the river and the central city with moderate climate.
基于类NPP-VIIRS夜间灯光数据的粤港澳大湾区城市建成区时空动态特征
Temporal- spatial changes of urban built- up area expansion in Guangdong- Hongkong- Macao Greater Bay Area, China based on NPP- VIIRS- like night light data
深度贫困地区增减挂钩节余指标跨省交易的路径研究
Study on the path of cross-provincial transaction of increasing or decreasing linked saving index in deeply impoverished areas
中国县级人口变动的空间格局及影响因素: 基于第七次全国人口普查数据的新探索
A county-level analysis of China's population change: Insights from the 7th Population Census
中国小城镇镇区土地利用结构特征
DOI:10.11821/dlxb201905013
[本文引用: 1]
小城镇镇区土地利用结构是小城镇社会经济发展的基本空间映射,是小城镇规划管理的关键问题之一,合理的空间结构能够促进小城镇功能的发挥和用地效益的提升。当前该领域的研究主要侧重某一区域或者某一类型的研究,全国层面的调查研究较少,造成当前理论研究结论的普适性和可推广性较低。采用2016年住房和城乡建设部全国121个镇的调查数据,对中国小城镇镇区土地利用结构特征进行深入分析并揭示其特征形成机制。研究发现:① 由于镇区人口少、规模差异小,不同人口规模小城镇之间的土地利用结构有差异,但是不突出。② 多数小城镇受镇区产业空心化影响,用地结构的居住服务功能较为显著。③ 小城镇镇区用地结构与区域经济发展水平、工业化发展水平密切相关,经济发展水平高的地区,工业用地占比高。④ 受大城市辐射和虹吸作用影响,近郊小城镇土地利用结构的城市化现象明显。⑤ 土地所有制与用地结构密切相关,国有土地占比高的镇,公共设施用地比例高。本研究对于丰富和完善中国小城镇理论研究具有重要的理论价值,对于指导小城镇规划建设具有重要的实践价值。
Characteristics of land use structure in small towns of China: Empirical evidences from 121 townships
<p id="C3">Land use structure is one of the fundamental spatial features of socioeconomic development. It is also a key issue of urban planning and management in small towns because proper land use structure is related to the improvement of urban function and land use efficiency. The existing literature on land use structure in townships of China is dominated by the studies which either focus on a given region or one certain type of townships, while a nation-wide study is missed. As a result, a generalized knowledge of land use structure in townships remain scarce. This paper aims to fill the research gap. Using the data of 121 townships from a survey conducted under the leadership of the Ministry of Housing and Urban & Rural Development, the paper analyzes the characteristics of land use structure and its mechanisms in townships in China. The results of analysis show that: (1) There is a small variation in land use structure between the townships due to a small size of total population and slight difference in population size between them; (2) Residential land use occupies a high proportion of the total area of land use in most townships due to industrial hollowing-out; (3) Land use structure is significantly related with industrialization and economic growth, and the higher level of economic growth, the higher proportion of industrial land use; (4) Land use structure in the townships which are located near to the large cities shows a clear trend of urbanization-featured land use due to the spillover effects and siphonic effects from these large cities; (5) Land use structure in the townships is obviously affected by land ownership and a higher proportion of state-owned land is related with a higher level of land use for public service facilities. The findings of this paper would have important theoretical values of enriching the existing literature and practical values of guiding urban planning and construction in townships of China.</p>
以县城为基点的城镇化新发展阶段效用解析
Utility analysis of the new development stage of urbanization based on county towns
