

1 引言
全球气候变化和大型水库均可能对局地降水产生影响,相关的科学问题是最近十几年的研究焦点。局地气候变化主要受大气环流变化影响[1,2]。在全球气候变暖的背景下,增温以及大气环流指数变化对局地降水的影响依然存在不确定性[3⇓-5]。研究表明[6],全球平均温度与全球极端降水量的变化成正比,即温度每升高1℃,极端降水的中等强度情形增加5.9%~7.7%。在中国西南地区,由快速升温引起的区域饱和水汽压快速增加,导致该地区小、中降水事件大幅减少而极端降水事件增加[7]。增温影响地表下垫面的蒸散发速率,亦是局地降水的重要水汽来源,重庆夏季近源局地蒸发水汽占比高达55.07%[8]。中国西南地区的降水主要出现在暖季(5—9月)[9],由此可以推定暖季温度变化(Warm Season Temperature,WST)对局地降水可能产生重要影响。另一方面,大气环流指数变化对西南地区不同季节的降水产生了不同的影响。例如对于冷季降水,冬春季(1—3月)北极涛动(Arctic Oscillation,AO)影响了中国中西部地区低层湿度场分布,冬春季AO相位变化和中国西南地区同期冬季降水距平具有一致性,其活动增强时,会造成西南地区降水增加[10,11]。冬季北大西洋涛动(North Atlantic Oscillation,NAO)与中国西南地区冬季(12—次年2月)降水存在正相关关系,且这种关系在冬季NAO负相位时更为显著[12,13]。对于暖季降水,影响中国西南地区夏季降水的大气环流因素主要是西南季风(Southwest Monsoon,SWM)和东南季风(Southeast Monsoon,SEM),二者总共贡献了>60%的夏季降水水汽[14],其强弱对西南地区暖季降水有着极其重要的影响[8,14,15]。综上所述,上述的气候驱动因子均可能对中国西南地区局地降水产生不同程度的影响,其综合效果还有待进一步研究与验证。
大型水库通过湖泊效应可能会对局地气候产生一定的调节作用[16]。这是由于大型水库显著改变了下垫面类型,从而影响地表水汽的蒸散发速率。水库的存在会降低下垫面温度,减少气流的上升运动,增加低层水汽辐散从而导致降水减少;同时也会减少云量,增强净辐射量,下垫面升温,引起更多的水汽蒸发导致降水增加[17]。可见,大型水库对周边地区降水的影响效果是前述情况的综合结果,因地而异且影响范围和结果多样化。例如,林浩等[18]认为大型水库明显影响区域气候,总库容在10亿 m3以上,水面面积超过100 km2的大型水库的气候影响区域的面积大致同水库水面面积相等或略大,平均距离从几公里到数十公里。如安康水库蓄水后,除冬季外的其他各季、年、主汛期降水量都比蓄水前有所减少,且秋季、年、主汛期蓄水前后差异显著[19]。小浪底水库蓄水后,库区降水的下降趋势较蓄水前明显减弱,蓄水后库区内年降水量略有增加,而周边降水量略有减少[20]。基于数值模拟的结果显示:美国佛森大坝修建后,大坝下游地区的最大降水量相比于建坝前有所增加,而上游地区的最大降水量则有所减少[21]。也有研究表明,大型水库修建对局地降水几乎没有影响[22]。总而言之,水库蓄水后对区域降水的影响亦存在不确定性。目前的研究结果倾向性认为大型水利工程会改变周围地区的小气候,尤其在水库蓄水后对其局部气候影响较大[23]。
作为世界最大的河道型水库,三峡水库自2003年投入使用至今,库区水位由66 m上升至175 m,水域面积扩大至1084 km2[24]。目前,研究表明三峡水库蓄水后对库区及周边区域降水特征存在多方面的影响。有的观点认为三峡水库蓄水前后年降水量无明显变化,对气候仅存局地影响,范围不超过20 km[17,25]。另有观点与之相悖,即三峡水库的水域面积超过1000 km2,对区域气候的影响是区域尺度(100 km)而非局地尺度(10 km),三峡水库蓄水后导致库区以北的大巴山-秦岭区域降水增加而三峡库区降水减少[26]。还有观点认为三峡水库蓄水后影响区域降水量周期性,蓄水引起库区降水量的2a、4a的次长周期效应加强,蓄水初期库区降水1a的主周期性减弱,大坝附近区域降水的多周期性特征明显[27]。另外,基于不同的数据源得出的结论可能也不一致,例如三峡水库蓄水前后,基于器测数据的区域极端降水差异显著,且水库蓄水对远库区的影响要大于近库区;而基于热带测雨卫星的栅格数据则表明三峡水库修建前后对区域的极端降水无影响[24]。总之,目前关于三峡水库蓄水后对周边地区降水的影响研究尚无统一结论。
现有对特定区域降水特征的研究仅关注了年际和季节性降水量,而未提及降水变率特征。降水变率是表征特定时间内降水量变异性的重要指标,能够很好地反映降水的时间异质性[28]。为更好的总结三峡库区1955—2019年的器测降水特征,本研究首次计算并纳入降水变率对三峡库区及周边地区分区讨论以凸显降水的空间异质性,结合典型的序列分析方法对比三峡库区降水与气候驱动因子变化特征,探讨三峡水库蓄水前后局地降水变化及其可能原因,有助于深入理解大型水利工程蓄水对局地气候的影响,为保护长江中下游水生态安全提供参考依据。
2 研究区概况
三峡大坝是世界上最大的水利枢纽工程,同时是治理开发长江流域的关键性骨干工程,其具有防洪、发电以及航运等多方面功能。三峡大坝始建于1993年,于2003年蓄水位至139 m后开始发电,2009年蓄水位达到175 m,三峡库区总库容达393亿 m3,全长约600 km,平均宽度为1.1 km,总面积达1084 km2[24]。三峡库区的范围大约在29°16′N~31°25′N、106°50′E~110°51′ E之间,库区位于四川盆地和长江中下游平原的结合部,跨越鄂中山区峡谷及川东岭谷地带,西起重庆江津,东至湖北宜昌,包括重庆市22个县(区)以及湖北省的4个县,总面积约5.8万km2。三峡库区属于亚热带湿润季风气候,气候表现为冬短夏长,降水充沛但季节分配不均,具冬干、夏雨、伏旱、秋淋的特征[29]。库区地处于大巴山褶皱带、川东平行岭谷和川鄂湘黔隆起褶皱带交汇处,背倚大巴山,南抵云贵高原[30]。库区内地形较为复杂,奉节以东属川东鄂西山地,奉节以西属川东平行峡谷低山丘陵区,山高坡陡,高差悬殊,河谷深切。河谷平坝约占库区总面积的4.3%,丘陵占21.7%,山地占74%。库区内物种资源丰富,主要植被类型为常绿阔叶林、落叶阔叶混交林、落叶阔叶林与常绿针叶混叶林、针叶林和灌草丛等[31]。研究区地理位置、气象站点分布及三峡水库相对水位、水域面积情况[32]18,25见图1。
图1
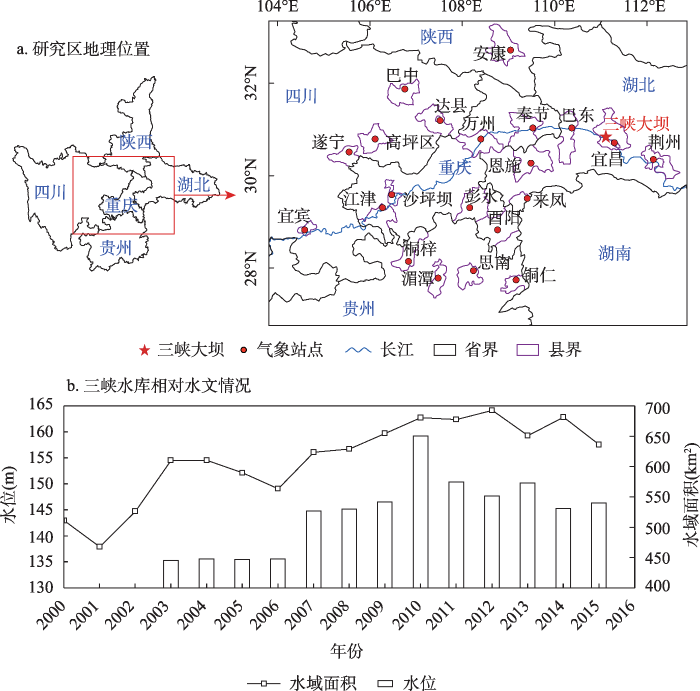
图1
研究区地理位置、气象站点分布及三峡水库相对水位、水域面积情况
Fig. 1
Location of the study area and distribution of weather stations, water level and water area of the TGR
3 研究方法
3.1 数据来源
本研究资料来源于国家气象科学数据中心(
北极涛动指数AO、北大西洋涛动指数NAO均来自美国海洋和大气管理局(NOAA)(
3.2 降水分区
区域降水的表征中,降水量的大小和变率都至关重要。本研究引入香农熵(SE)(即香农多样性指数)对降水量转换计算,后得到标准化变异系数(SVI),将SVI应用于17个时间序列(12个月时间序列,4个季节性时间序列和1个年度时间序列)来评估各时间尺度上的年际(内)变化。香农熵(SE)代表了随机变量的平均信息量,可用于计算数据分布的可变性,在信息学、生态学等领域有极广泛的运用[33⇓-35]。同样的,它也被用于降水序列的变异分析[36]。因此,基于香农熵(SE)的指标SVI能表征特定时间段降水序列变异大小,其取值范围为0~1,0表示无变异性,1表示高变异性[28]。根据年、季和月降水量时间序列得到的SVI,有助于了解年际内不同时间尺度降水量的波动情况。将多个时间尺度上的平均降水量和相应的SVI值以及经纬度、海拔数据按lg(100x+1)转换以消除量纲和极端值的影响后,用主成分分析(PCA),得到本研究区降水的空间聚类结果。
具体计算公式如下:
式中:n表示降水时间序列的年数,本研究中n=65;
3.3 季风指数
同理定义东南季风指数
式中:
3.4 统计方法
本研究主要采用单因素方差分析法、配对样本t检验、Mann-Kendall趋势及突变检验法(M-K检验)、滑动t检验法、Kendall′s tau-b非参数相关性分析法[39]、冗余分析(ReDundancy Analysis,RDA分析)、小波相干变化(Wavelet Transform Coherence, WTC)、多元线性回归分析等统计方法对三峡库区及周边地区的降水量特征进行分析。单因素方差分析法和配对样本t检验用于检验区域降水参数的显著性。M-K检验常用于判断气候序列中是否存在气候突变并确定突变发生的时间节点[40]。在M-K检验中,需将时间序列标准化得到UF曲线,与经转化的逆时间序列标准化得到的UB曲线一起作图,若UF曲线与UB曲线在置信区间之内相交且交点唯一时,说明时间序列在该点存在突变;若交点不唯一时,则用滑动t检验法逐点验证其突变的显著性。滑动t检验法的统计量t与显著性水平为α的临界值
式中:
单因素方差分析、配对样本t检验、Kendall′s tau-b非参数相关性分析、多元线性回归在SPSS 22中完成,M-K检验、滑动t检验以及WTC在Matlab 2020b完成,PCA和RDA分析在软件Canoco 5.0中完成,作图在ArcMap 10和Origin 2017pro中完成。
3.5 基于气候驱动因子的降水重建
考虑到气候驱动因子(WST、SWM、SEM、AO、NAO)对降水的影响存在季节性特征,本研究选取各区域月降水以及与区域月降水关系显著的气候驱动因子,按lg(100x+1)转换上述指标的数据矩阵以消除量纲和极端值的影响,应用RDA分析将月降水和气候驱动因子的多元对应关系降维处理,在二维排序图上直观呈现月降水参数和气候驱动因子的关系,同时得到气候驱动因子对RDA排序轴的解释度和显著性。采用与RDA排序轴具显著关系(P<0.05)的气候驱动因子作自变量,以三峡水库2003年蓄水前的年降水量作因变量构建线性回归方程,并基于回归方程计算2003年以后的理论年降水(即无三峡水库情形下的理论降水)。经配对样本t检验验证水库蓄水后理论年降水与实测降水的显著性差异以评估非气侯影响因素(如水库效应)对降水的影响。
4 结果与讨论
4.1 降水分区
基于PCA结果,可将研究区大致分为3个区域:西北部地区、腹地地区以及南部地区(图2)。西北部地区包括安康、达县、高坪区、巴中、遂宁5个站点;腹地地区包括荆州、宜昌、巴东、奉节、万州5个站点;南部地区包括恩施、来凤、铜仁、酉阳、思南、彭水、湄潭、桐梓、沙坪坝、江津、宜宾11个站点。
图2
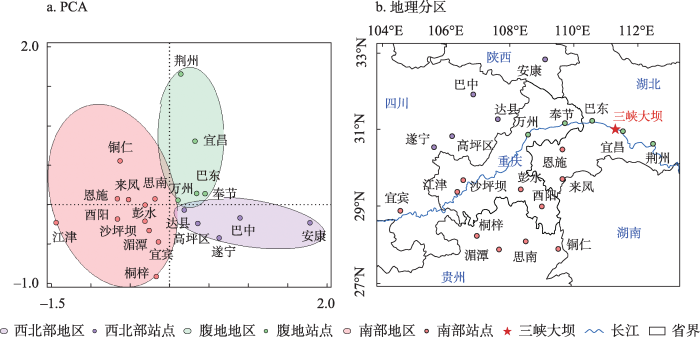
图2
基于降水量、降水SVI、地理空间参数的PCA聚类结果
Fig. 2
PCA results based on precipitation amount, SVI of precipitation and geospatial parameters for spatial cluster of weather stations
4.2 区域降水特征
4.2.1 月降水
结合各区域多年月平均降水量及月时间尺度下的变异性(SVI)分析得出(图3),各区域月平均降水量特征:均为夏多冬少、南部>腹地>西北部。西北部与南部在多个月份(1—6月、9月、11—12月)均存在显著性差异(P<0.05),西北部与腹地在2—4月以及11月的降水量存在显著性差异,而腹地与南部仅在6月和12月存在显著性差异。三个区域在7—10月的差异不大,表明随季风深入各区域形成稳定强降水。各区域在月时间尺度下的变率特征:1月、2月、12月大,3—9月变率小;西北部>腹地>南部。不难看出,3—9月降水量主导全年降水,1月、2月、12月降水量恰为全年最小,即降水量多的月份对该地区降水量变率影响不大,而降水量较少的月份对该地区降水量变率影响较大。
图3
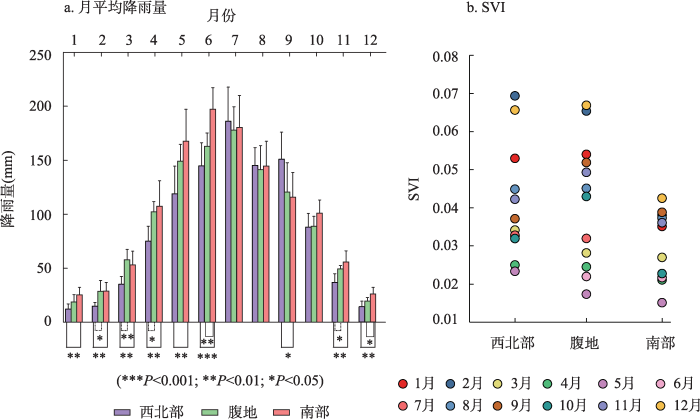
图3
各区域多年月平均降水量及对应的月降水SVI月值
Fig. 3
Multi-year averaged monthly mean precipitation and its SVI in each region
4.2.2 年降水
各区域年降水量大多超过1000 mm(图4,见第1928页),南部地区年降水量多年平均最高(1201.9±126.6 mm),腹地次之(1115.4±155.1 mm),西北部最少(1019.7±143.3 mm)。在过去65a中,西北部年均降水量超过1000 mm的有37a,腹地有53a,南部地区最多为61a。各区域的降水量年际变化较大,西北部1956年为历年最多,为1300.4 mm,1997年最少,为695.1 mm;腹地1983年最多,为1522.7 mm,1966年最少,为756.0 mm;南部2016年最多,为1456.7 mm,2011年最少,为912.3 mm。西北部降水量在1985年以前上升趋势较为平缓,1985—2000年显著减少,其后呈增加趋势但增势平缓;腹地地区的年降水量持续在均值附近波动,总体变化趋势不大;南部地区年降水量在1980年以前呈增加趋势,随后年降水量波动变化,在2010年后降水呈明显增加的趋势。
图4
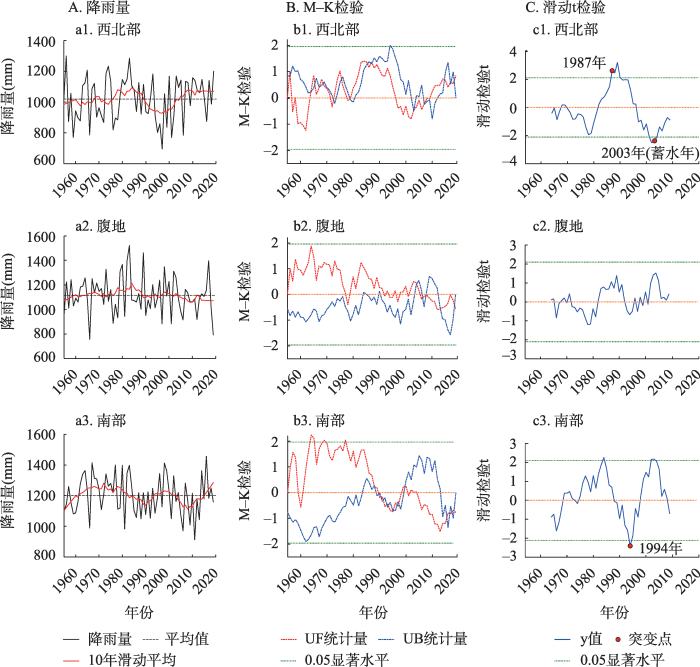
图4
各区域逐年降水特征及年降水突变情况
Fig. 4
The characteristics of annual rainfall and the abrupt change of annual precipitation in each region
为探究1955—2019年研究区各区域降水量是否存在突变现象,经M-K检验及10年滑动t检验得知:尽管库区西北部存在UF和UB的多个交点(即潜在的M-K突变点),但是仅有1987年、2003年的降水突变点通过了显著性水平检验(P<0.05),即认为西北部降水在1987年、2003年存在突变,其中,西北部2003年的降水突变是否与三峡水库蓄水有关需进一步探究。同理,腹地年降水未通过显著性水平检验(P>0.05),认为其降水不存在突变点;南部仅在1994年存在一个降水突变点。
4.3 气候驱动因子对降水的贡献
表1 各区域不同时间尺度下降水与驱动因子的Kendall′s tau-b相关性
Tab. 1
| 地区 | 月份 | AO | NAO | SWM | SEM | T月均值(℃) |
|---|---|---|---|---|---|---|
| 西北部 | 1 | 0.178* | 0.175* | 0.103 | -0.014 | -0.114 |
| 2 | 0.189* | 0.132 | 0.001 | -0.007 | 0.017 | |
| 3 | 0.169* | 0.066 | -0.036 | 0.091 | -0.055 | |
| 4 | 0.151 | -0.011 | 0.012 | -0.103 | 0.116 | |
| 5 | 0.153 | 0.135 | -0.041 | -0.155 | 0.170* | |
| 6 | -0.001 | -0.150 | 0.174 | -0.057 | 0.068 | |
| 7 | 0.002 | -0.048 | 0.210* | 0.121 | -0.092 | |
| 8 | -0.007 | -0.153 | 0.291** | 0.156 | -0.487*** | |
| 9 | 0.064 | 0.077 | 0.319** | -0.044 | -0.138 | |
| 10 | -0.029 | -0.016 | 0.152 | -0.242* | 0.146 | |
| 11 | 0.194* | 0.194* | 0.154 | -0.125 | -0.039 | |
| 12 | 0.013 | 0.014 | 0.133 | -0.143 | -0.041 | |
| 年均值 | 0.028 | -0.025 | 0.091 | -0.057 | -0.115 | |
| 腹地 | 1 | 0.215* | 0.231** | 0.172 | -0.036 | -0.089 |
| 2 | 0.231** | 0.210* | 0.158 | -0.139 | 0.207* | |
| 3 | 0.122 | 0.012 | 0.083 | 0.040 | 0.044 | |
| 4 | 0.123 | -0.026 | 0.111 | -0.141 | 0.130 | |
| 5 | 0.154 | 0.157 | 0.053 | -0.051 | -0.014 | |
| 6 | -0.009 | -0.063 | 0.228* | 0.010 | 0.012 | |
| 7 | -0.010 | -0.009 | 0.271** | 0.291** | -0.313*** | |
| 8 | 0.012 | -0.156 | 0.426*** | 0.242* | -0.441*** | |
| 9 | 0.091 | 0.029 | 0.267** | 0.097 | -0.233** | |
| 10 | 0.135 | 0.156 | 0.396*** | -0.018 | 0.078 | |
| 11 | 0.036 | 0.114 | 0.303** | -0.148 | 0.022 | |
| 12 | 0.014 | -0.034 | 0.416*** | -0.176 | 0.032 | |
| 年均值 | 0.063 | 0.027 | 0.097 | 0.161 | -0.087 | |
| 南部 | 1 | 0.256** | 0.196* | 0.085 | 0.141 | -0.081 |
| 2 | 0.207* | 0.175* | 0.014 | -0.024 | 0.044 | |
| 3 | 0.138 | 0.002 | -0.261* | 0.008 | 0.122 | |
| 4 | 0.122 | -0.093 | 0.073 | -0.006 | 0.041 | |
| 5 | 0.100 | 0.088 | 0.168 | 0.097 | -0.151 | |
| 6 | 0.085 | 0.031 | 0.335*** | 0.323** | -0.145 | |
| 7 | -0.054 | -0.102 | 0.388*** | 0.352*** | -0.442*** | |
| 8 | -0.014 | -0.130 | 0.347*** | 0.366*** | -0.479*** | |
| 9 | 0.009 | 0.066 | 0.380*** | 0.295** | -0.363*** | |
| 10 | 0.157 | 0.185* | 0.301** | 0.048 | 0.155 | |
| 11 | 0.105 | 0.044 | 0.225* | 0.074 | -0.048 | |
| 12 | 0.032 | -0.078 | 0.379*** | 0.013 | -0.013 | |
| 年均值 | -0.012 | -0.024 | 0.252* | 0.264* | -0.166 |
注:*** P<0.001;** P<0.01;* P<0.05。
为进一步量化各气候驱动因子对研究区降水量及降水SVI的贡献,基于各气候驱动因子对各区域降水的相关性(表1,见第1929页)对其进行RDA分析。考虑到气候驱动因子的季节影响特征,基于表1结果,AO、NAO为1、2、12月指数均值,SWM、SEM为6—9月指数均值,WST为5—9月指数均值。结果显示,前两个轴解释了25.92%的变异,第一轴解释了20.52%的变异,第二轴解释了5.40%的变异(图5,见第1930页)。各驱动因子对研究区降水的贡献由大到小依次为SWM、WST、AO、SEM和NAO(表2,见第1930页)。SWM与WST对研究区降水的贡献最大,其对轴的解释度分别达到了14.4%和4.3%。这说明研究区的降水主要受SWM、WST的影响,其次受AO和SEM的影响,NAO的贡献不显著。
图5
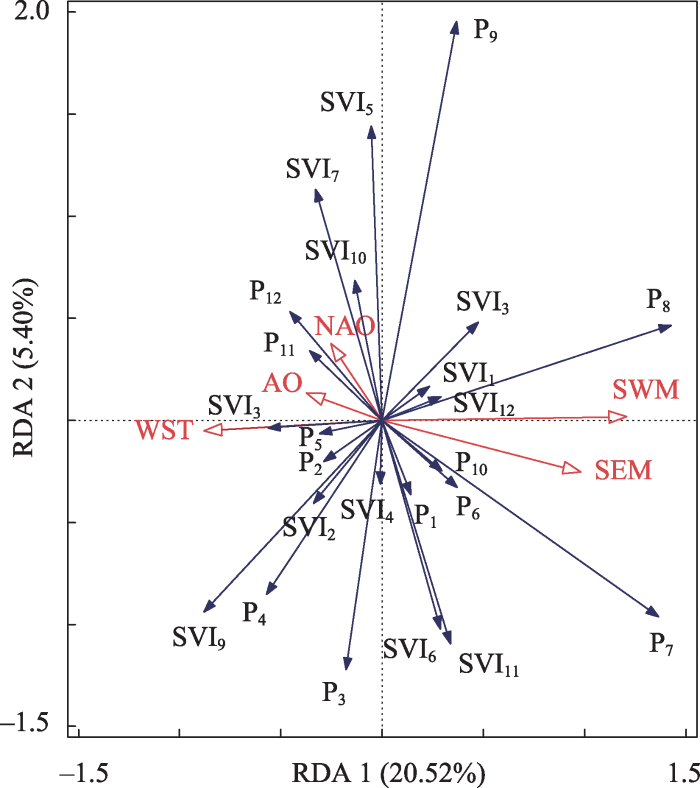
图5
气候驱动因子对研究区降水量及降水SVI的贡献
注:图中SVI1~ SVI12为标准化变异系数(下角标1~12为月份); P1~ P 12为月平均降雨量(下角标1~12为月份)。
Fig. 5
Contribution of climate driving factors to precipitation amount and its SVI in the study area
表2 基于RDA的气候驱动因子贡献统计汇总
Tab. 2
| 解释度(%) | 贡献值(%) | P | |
|---|---|---|---|
| SWM | 14.4 | 50.1 | 0.002 |
| WST | 4.3 | 15.1 | 0.036 |
| AO | 3.9 | 13.5 | 0.046 |
| SEM | 3.8 | 13.4 | 0.040 |
| NAO | 2.3 | 8.0 | 0.306 |
4.4 气候驱动因子突变
库区西北部在1987年、2003年存在降水突变点,库区南部在1994年存在一个降水突变点,而腹地地区年降水无突变点。上述的降水突变是否是气候驱动因子引起的,可以根据气候驱动因子是否具有相同的突变点进行推测,即降水和气候驱动因子若突变的时间节点一致,则表明降水的变异很可能是气候驱动因子引起的;反之,若突变的时间节点不一致,这说明降水可能是由其他因素引起的。经检验发现AO、NAO、SWM和SEM在1955—2019年间不存在突变年,WST在2004年存在突变现象(图6,见第1931页),即WST在2004年后增加但相对于2004年之前无显著性差异。需要指出的是,WST的M-K检验UF和UB有唯一交点,可忽略滑动t检验而认定为真实突变点[41]20。通过分析气候驱动因子(AO、NAO、SWM、SEM、WST)在水库蓄水(2003年)前后的显著性差异,发现上述气候驱动因子在水库蓄水前后不存在显著性差异(P>0.05)。因此,可初步判定西北部在水库蓄水后降水量的突变并非由气候驱动因子引起。
图6
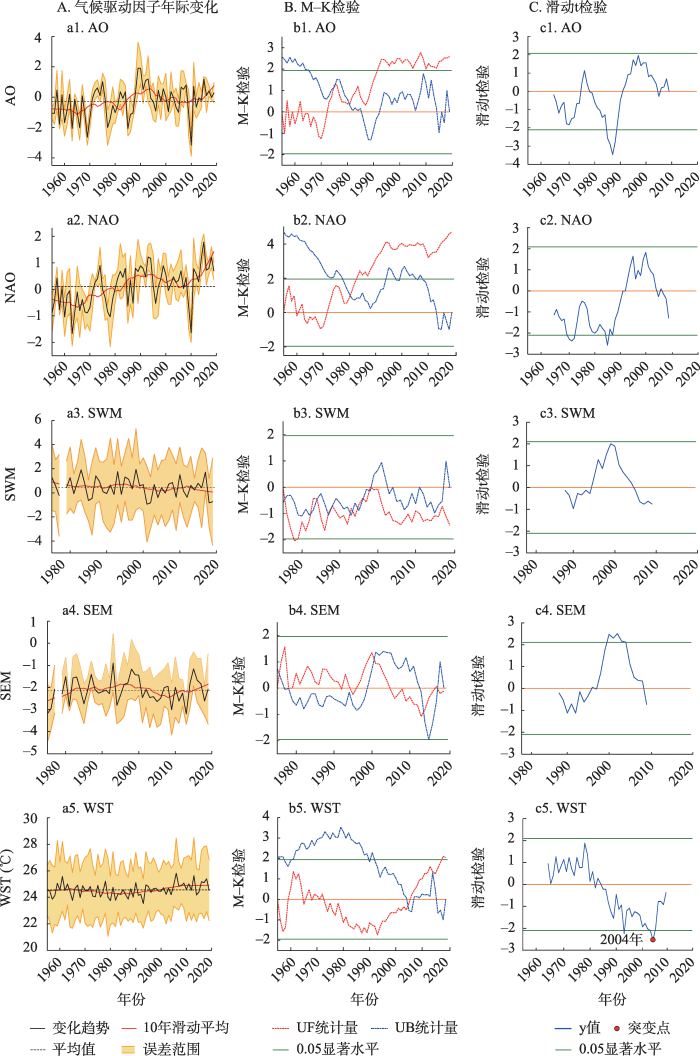
图6
气候驱动因子年际变化及其M-K检验、滑动t检验
Fig. 6
Interannual variations of climatic driving factors and the associated abrupt changes based on M-K test and moving t-test
4.5 降水与气候驱动因子的周期关系
图7
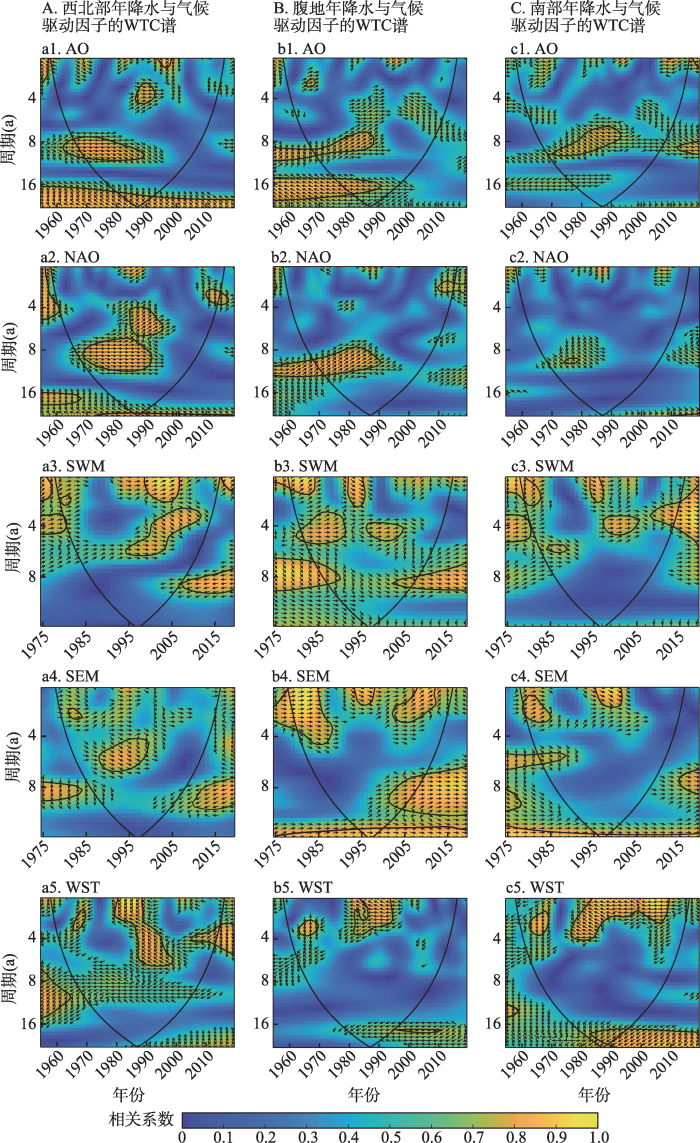
图7
驱动因子与年降水的小波相干(WTC)谱
注:图中右(左)向箭头为正(负)相关,上(下)箭头为降水滞后(超前)于驱动因子;锥形实线内的闭合曲线表示超过95%置信检验水平。
Fig. 7
WTC spectra based on driving factors and annual precipitation
(1)AO与三个区域在1970—1990年期间存在显著的7~11a的周期性。此外,AO与西北部年降水存在3~5a(1986—1993年),与腹地年降水存在16~20a(1967—1990年)的共振周期。
(2)NAO与西北部年降水的周期相关性最强,离散分布如下共振周期:1~2a(1983—1988年)、2~4a(2010—2015年)、4~6a(1984—1995年)、7~11a(1970—1990年)。NAO与腹地存在8~11a(1970—1990年)的周期性,与南部的年降水周期相关性弱。
(3)SWM与研究区年降水呈显著的正相关性,其中SWM与西北部年降水存在1~2a(1979—1982年、1999—2005年)、3~7a(1994—2012年)的共振周期。SWM与腹地年降水显著存在3个共振周期,分别为1~2a(1978—1983年、1991—1995年)、3~5a(1981—1990年、1995—2005年)、7~10a(1984—1990年、2002—2006年)。SWM与南部年降水在存在1~2a(1978—1981年、1994—1996年)、3~4a(1995—2006年、2007—2013年)以及6a(1984—1988年)的共振周期。
(4)SEM与研究区年降水显著正相关,其中与西北部年降水显著性周期较其他区域长,存在4~7a(1988—2000年)的共振周期;与腹地、南部年降水存在显著的1~2a短周期相关性,且与腹地的周期性更明显。
(5)WST与三个区域年降水显著负相关,均存在1~4a的共性共振短周期。需要注意的是,2003年前后,西北部年降水1a的周期滞后于WST但未通过95%显著水平,表明二者无显著的时滞相关性。而WST在2004年的突变点虽与西北部在2003年的突变点临近,但二者无显著1a周期的时滞相关性,表明西北部2003年降水的突变并非由WST引起而很可能是由其他因素引起的。
总的来说,SWM、SEM、WST与年降水存在较显著的1~4a短共振周期,而NAO与AO类似,与年降水的共振周期以7~11a为主,且NAO对南部年降水影响较弱。综合前述研究区降水和气候驱动因子突变情况,可判定库区西北部于蓄水后的降水突变并非由气候驱动因子引起。
4.6 蓄水前后降水差异
由研究区各区域蓄水前后(2003年)的月平均降水量对比(图8)可知:西北部蓄水后在2月及5—7月降水显著增加(P<0.05),3月、8—10月降水不显著增加(P>0.05);腹地在8月、10月、12月的降水显著减少(P<0.05),3月、5—7月不显著减少(P>0.05);南部地区仅8月降水显著减少(P<0.05),4—7月、10—12月不显著减少(P>0.05)。考虑到气候驱动因子在水库蓄水前后不存在显著性差异(P>0.05),因此推测三峡库区蓄水后对库区周边降水可能有直接或间接的影响,主要表现为:库区西北部暖季降水增加,而库区腹地和南部降水存在一定程度的减少。
图8
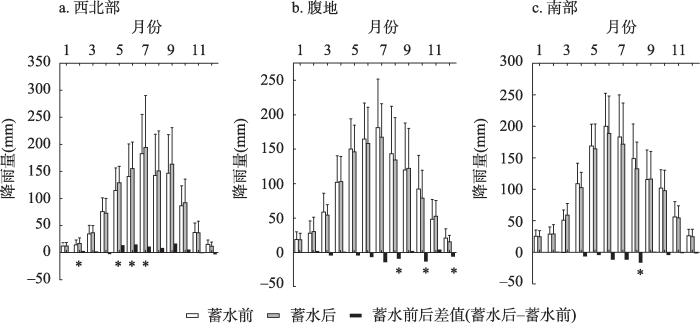
图8
各区域蓄水前后平均月降水量变化
注:*表示蓄水前后具有显著性差异(P<0.05)。
Fig. 8
Variation of the month-averaged precipitation before and after reservoir impounding in each region
为量化水库蓄水对研究区降水的影响,基于气候驱动因子(AO、SWM、SEM、WST)和月降水构建的多元线性回归曲线(表3),以研究各区域蓄水前后降水量变化并用MAPE评估拟合效果。西北部回归方程方程预测模型MAPE=11.46%,腹地回归方程预测模型MAPE=10.30%,模拟效果均达到良好;南部回归方程预测模型MAPE=8.07%,模拟效果优异。结果表明:三峡水库蓄水后,西北部的年降水显著增加(P<0.05),比无水库的情形增加13.2%;腹地年降水仅比无水库的情形增加0.1%,但无显著差异(P>0.05);南部年降水比无水库情形减少1.5%(P>0.05)。综上,三峡水库蓄水后库区西北部年降水显著增加,而腹地及南部地区无明显变化(图9)。
表3 各区域降水的多元线性回归曲线
Tab. 3
| 多元线性回归方程 | Sig. | R2 | F | MAPE(%) | |
|---|---|---|---|---|---|
| 西北部 | 0.088 | 0.298 | 2.329 | 11.46 | |
| 腹地 | 0.072 | 0.313 | 2.503 | 10.30 | |
| 南部 | 0.030 | 0.373 | 3.276 | 8.07 |
注:x1、x2、x3、x4分别代
图9
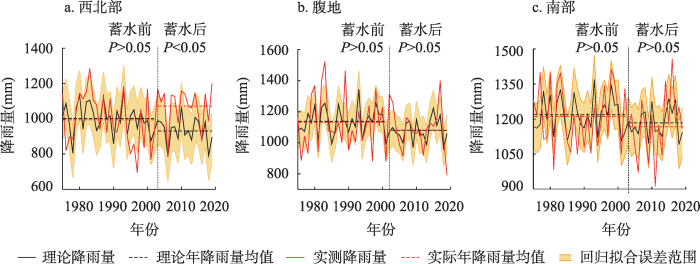
图9
各区域蓄水前后实测年降水与理论降水比对
Fig. 9
Theoretical and measured annual precipitation before and after impoundment in each region
4.7 水库蓄水影响降水的可能机理
Wen等[52]利用WRF-CLM模型发现鄂陵湖和扎陵湖会促进湖面低层水平辐合和上升气流,并提供了能量和水汽,有利于湖区和附近地区7—10月的降水。三峡水库蓄水后,坝前水位较建坝前抬升60 m以上,汛期(7—9月)水域面积由2002年的526.5 km2增至2003年的610.6 km2[32]18。从2001年至2015年,三峡水库表面积由884.4 km2增至1106.2 km2[53],其蒸散量也相应增加[54,55]。崔豪[56,57]的研究表明:三峡库区流域蒸发量与同期温度和降水均呈正相关关系,三峡水库蓄水后年平均实际蒸散发量及植被蒸腾量、植被蒸发量较蓄水前有所增加且夏季最高,其主要影响因素是气温。本研究中,WST在2004年后存在正向突变,据此推测WST的升高能一定程度促进夏季降水。李强等[58]通过加入水体的敏感性试验对三峡地区的下垫面效应进行研究,发现局地水体下垫面能通过增加地表热通量和水汽输送对降水起促进作用。根据美国佛森大坝蓄水前后降水的差异及影响机理[59]类比推理得出:研究区暖季主盛行西南季风和东南季风,在三峡水库蓄水后暖季季风强度未明显变化的背景条件下(图6),相对稳定的季风向将库区蒸发的水汽带至下风区(西北部),从而利于西北部降水增加。
黄亚[60]模拟了三峡库区水体面积为960 km2(方案1,与现今情形较接近)和4800 km2(方案2)时对库区降水的影响,发现两种模拟方案均出现库区各季节降水及年降水减少的现象,其中方案1的库区年降水仅减少约7%,方案2的减少22%,这说明三峡水库的局地气候效应存在且受水体面积的影响。局地尺度的环流受下垫面变化影响,会再分配局地水汽,但方案1中近地表的白天水汽辐散和夜间水汽辐合仅十分微弱地增强,换言之,三峡水库蓄水未显著改变库区水面垂向散度场格局。此外,水库蓄水后水面积的增加缓冲昼夜温差,气层稳定,抑制水平和垂向对流活动,导致对流降水减少。综上,这可能是腹地和库区南部地区在月降水不显著变化的原因。
本研究数据得出驱动因子与降水变率SVI之间的相关性不显著(P>0.05,未列出),猜测可能是由季风频率[61]引起的。未来该区域的降水特征及影响机理还有待更全面的观测、更长时间尺度的验证及更深层次的探究。
5 结论
本研究分析了三峡库区不同时间尺度下的降水特征,结合气候驱动因子,评估了三峡水库蓄水对降水的影响,得到如下结论:
(1)研究区降水夏多冬少,月份、年际的降水南部>腹地>西北部;降水多的月份降水SVI低,降水少的月份降水SVI高。西北部降水在三峡水库蓄水当年(2003年)存在突变,腹地和南部均无2003年的突变。
(2)气候驱动因子在不同时间尺度下显著影响研究区降水,AO与研究区冷季降水正相关,SWM主要影响研究区夏、秋季的降水,SEM和WST主要影响研究区夏季降水,WST与降水呈显著的负相关关系。WTC结果表明,SWM、SEM、WST与降水存在较显著的1~4a短共振周期,而NAO、AO与降水以7~11a的共振周期为主。基于气候驱动因子、降水量及降水SVI的RDA第一轴解释了20.52%的变异,第二轴解释了5.40%的变异。驱动因子对降水特征轴的贡献由大到小依次为SWM(14.4%)、WST(4.3%)、AO(3.9%)、SEM(3.8%),NAO的贡献不显著。上述气候驱动因子在水库蓄水前后(2003年)无显著性差异(P>0.05),表明西北部降水2003年的突变可能与三峡水库蓄水有关。
(3)三峡水库蓄水后,库区西北部2月、5—7月平均降水显著增加(P<0.05),3月、8—10月不显著增加(P>0.05);库区腹地8月、10月、12月的降水显著减少(P<0.05);南部8月降水量显著减少(P<0.05)。蓄水后,相对于无水库情形,西北部的年降水显著增加13.2%(P<0.05);腹地年降水增加0.1%、南部年降水减少1.5%,但二者变化不显著(P>0.05)。表明三峡水库蓄水后可能导致库区西北部降水增加,而对库区腹地及南部影响较小。
(4)三峡水库蓄水后对周边地区降水的可能影响机理如下:西北部降水量的增加可能是由于三峡水库蓄水后,由于水体面积以及WST的增加,导致蒸散量相应增加。研究区相对稳定的风向将蒸发水汽带至向下风区(西北部),利于西北部降水增加。三峡水库蓄水几乎对库区水面垂向散度场格局无影响,但蓄水引起的水面积的增加缓冲昼夜温差,气层稳定,抑制对流,减少对流降水,可能是腹地和南部地区在月降水不显著变化的原因。未来该区域的降水特征及影响机理还需深入探究。
致谢
衷心感谢匿名评审专家在论文评审中所付出的时间和精力,评审专家对文章逻辑、结果验证、文字表述等方面的修改意见,使本文受益匪浅。
参考文献
云南5月雨量与热带海温异常及亚洲季风变化的关系
Relationship between precipitation in May over Yunnan and the changes of tropical sea surface temperature and Asia monsoon
Climate change will affect global water availability through compounding changes in seasonal precipitation and evaporation
Both seasonal and annual mean precipitation and evaporation influence patterns of water availability impacting society and ecosystems. Existing global climate studies rarely consider such patterns from non-parametric statistical standpoint. Here, we employ a non-parametric analysis framework to analyze seasonal hydroclimatic regimes by classifying global land regions into nine regimes using late 20th century precipitation means and seasonality. These regimes are used to assess implications for water availability due to concomitant changes in mean and seasonal precipitation and evaporation changes using CMIP5 model future climate projections. Out of 9 regimes, 4 show increased precipitation variation, while 5 show decreased evaporation variation coupled with increasing mean precipitation and evaporation. Increases in projected seasonal precipitation variation in already highly variable precipitation regimes gives rise to a pattern of "seasonally variable regimes becoming more variable". Regimes with low seasonality in precipitation, instead, experience increased wet season precipitation.
全球气候变暖背景下水城县近30 a气温与降水变化的新特征
The new change characteristics of temperature and precipitation of Shuicheng in recent 30 years under the global climate warming
全球和中国变暖特征及未来趋势
Features and tendency of global warming and its implications for China
Certainty and uncertainty in understanding global warming
Global increasing trends in annual maximum daily precipitation
This study investigates the presence of trends in annual maximum daily precipitation time series obtained from a global dataset of 8326 high-quality land-based observing stations with more than 30 years of record over the period from 1900 to 2009. Two complementary statistical techniques were adopted to evaluate the possible nonstationary behavior of these precipitation data. The first was a Mann–Kendall nonparametric trend test, and it was used to evaluate the existence of monotonic trends. The second was a nonstationary generalized extreme value analysis, and it was used to determine the strength of association between the precipitation extremes and globally averaged near-surface temperature. The outcomes are that statistically significant increasing trends can be detected at the global scale, with close to two-thirds of stations showing increases. Furthermore, there is a statistically significant association with globally averaged near-surface temperature, with the median intensity of extreme precipitation changing in proportion with changes in global mean temperature at a rate of between 5.9% and 7.7% K−1, depending on the method of analysis. This ratio was robust irrespective of record length or time period considered and was not strongly biased by the uneven global coverage of precipitation data. Finally, there is a distinct meridional variation, with the greatest sensitivity occurring in the tropics and higher latitudes and the minima around 13°S and 11°N. The greatest uncertainty was near the equator because of the limited number of sufficiently long precipitation records, and there remains an urgent need to improve data collection in this region to better constrain future changes in tropical precipitation.
Precipitation change character in China and its' response to climate warming
基于LMDZ模型的西南地区水汽来源及水汽再循环率的分析
Analysis of water vapor source and contribution of recycled moisture to precipitation in southwest China based on LMDZ model
近40年三峡库区面雨量时空分布特征
Distribution characteristics of area rainfall in the Three Gorges Reservoir for recent 40 years
冬季北极涛动的影响分析
Influence of arctic oscillation on temperature and precipitation in winter
冬季北大西洋涛动与中国西南地区降水的不对称关系
The asymmetric relationship between the winter NAO and the precipitation in Southwest China
冬季北大西洋涛动对中国春季降水异常的影响
利用中国397个测站降水资料和NCEP/NCAR再分析资料, 采用相关分析、 合成分析等方法, 研究了冬季北大西洋涛动(NAO)对我国春季降水的影响。结果表明, 我国春季降水与前期冬季NAO关系密切, 冬季NAO偏强(弱)时, 我国东部南方地区春季降水偏多(少), 北方地区春季降水偏少(多)。冬季NAO信号通过波列形式传播至东亚地区, 使得春季东亚副热带急流和温带急流发生变化, 冬季NAO偏强(弱)时, 春季东亚副热带西风急流增强(减弱), 温带急流减弱(增强)。进一步分析表明, 冬季NAO异常会引起春季乌拉尔山高压脊和东亚大槽的变化, 导致东亚对流层上层的温度发生变化, 并由此产生经向温度梯度异常, 这可能是NAO影响东亚高空急流的原因之一。春季东亚对流层上层的气温变冷(暖), 使得东亚地区 30°-40°N区域产生下沉(上升)运动, 20°-30°N区域产生上升(下沉)运动, 最终导致我国东部南方地区春季降水偏多(少)、 北方地区春季降水偏少(多)。
Influence of winter North Atlantic Oscillation on spring precipitation in China
Based on the precipitationdata at397 stations in China and the NCEP/NCAR monthly reanalysisdata, the relations between the winter North Atlantic Oscillation (NAO) and the spring precipitation in China using the correlation analysis and composite analysis are studied. The resultsshow that the NAO significantly influence on the variations of spring precipitationin China. Associated with the positive (negative) NAO, the precipitation inSouth China will increase (decrease) and the precipitation inNorth China will decrease (increase). Further analysis indicates thatwinter NAO can exert notable influence on the atmospheric circulation over East Asia by propagation of wave train. In strong positive (negative) NAO year, the East Asian subtropical westerly jet enhanced (weakened) and the East Asia polar-front jet weakened (enhanced). The NAO-related atmospheric circulation resultedin the abnormalities of temperatures on500~200 hPa, cause corresponding variations in meridional gradients of temperature. Perhaps it is one of the reasons why NAO impacts on westerly jet stream over East Asia. The further analysis indicates thatupper-level cooling (warming) is closely related to anomalous sinking (rising) motion in 30°-40° N and rising (sinking) motion in 20°-30°N. These changes result in a drier (wetter) condition in the northern China and a wetter (drier) condition in the southern China.
西南地区夏季极端降水的水汽来源分析
DOI:10.31497/zrzyxb.20210508
[本文引用: 2]

西南地区地形复杂,极端降水极易形成山洪并引发地质灾害,1998年夏季西南降水达709.3 mm,超出平均降水约23.9%。经使用水汽追踪模型WAM2layers和ERA-Interim再分析资料等大数据追踪西南降水水汽来源,发现西南夏季降水主要有四个源区,分别是西南季风区、西风带区、本地和东南季风区,1998年夏季分别贡献了330.1 mm、110.0 mm、104.8 mm和65.6 mm水汽,约占所追踪降水的52.2%、17.4%、16.6%和10.4%。西南季风区作为最大源区,贡献了超过一半的降水水汽。增加的降水其水汽主要来自西南季风区、西风带区和本地,比平均分别多贡献80.1 mm、29.3 mm和27.1 mm,合占所增加降水的99.9%;其中又以西南季风区贡献占主导。进一步发现,1998年夏季太平洋副高向西南延伸,并在北孟加拉湾和我国南海形成两个高压中心异常,导致西南季风向我国西南地区的水汽输送异常强劲,从而造成西南地区降水异常增多。
An analysis on moisture source of extreme precipitation in Southwest China in summer
The terrain in Southwest China (SWC) is very complicated, and it is prone to floods and relative geological disasters due to heavy rain. In summer 1998, the SWC precipitation reached a maximum of 709.3 mm, which is around 23.9% above the climate mean. By using a Eulerian model of moisture recycling WAM2layers and big data such as ERA-Interim reanalysis, the precipitation moisture in summer SWC was backtracked. It is found that there are four major source regions for SWC, which are the southwest monsoon region, the westerlies region, the local region, and the southeast monsoon region. They contributed around 330.1 mm, 110.0 mm, 104.8 mm, and 65.6 mm in water depth of SWC in summer 1998, which accounted for 52.2%, 17.4%, 16.6%, and 10.4% of the tracked precipitation moisture, respectively. The southwest monsoon region, from the west Indochina Peninsula to the Indian subcontinent to the Indian Ocean, as the largest moisture source, contributed more than half the precipitation moisture. The extra moisture of the extreme precipitation during summer 1998 came mainly from the southwest monsoon region, the westerlies region, and the local region, contributing about 80.1 mm, 29.3 mm, and 27.1 mm, respectively, above the average moisture contribution, which together accounted for 99.9% of the extra precipitation. The southwest monsoon region dominated the extra moisture contribution once again. Further analyses revealed that the Western Pacific subtropical high (WPSH) stretched to the southwest, forming two anomalous highs in the Northern Bay of Bengal and the South China Sea. This change made moisture transport by the southwest monsoon to SWC extremely strong, which resulted in extreme precipitation in SWC.
近50年西南地区极端干旱气候变化特征
Climate characteristics of the extreme drought events in Southwest China during recent 50 years
Based on the daily data of temperature and precipitation of 108 meteorological stations in Southwest China from 1960 to 2009, we calculated the surface humid indexes of months and years, as well as the extreme drought frequency. According to the data, the temporal and spatial characteristics of the extreme drought frequency in inter-annual, inter-decadal, summer monsoon and winter monsoon has been analyzed. The results are indicated as follows: (1) In general, the southwest of Sichuan Basin, the southern part of Hengduan Mountains, southern coast of Guangxi and north of Guizhou are the areas in which the extreme drought frequency has significantly increased in the past 50 years. For the decadal change, from the 1960s to the 1980s the extreme drought frequency has presented a decreasing trend, and the high frequency area appeared alternately in the southeast - northwest - east of Southwest China; the 1990s is the most wettest decade and it is wet over the whole area. In the 2000s, the extreme drought frequency rises quickly, but the regional differences reduce. (2) In summer monsoon, the extreme drought frequency is growing, which generally happens in the high mountains around the Sichuan Basin, most parts of Guangxi and "the broom-shaped mountains". It is obvious that the altitude has impacts on the extreme drought frequency of summer monsoon; in winter monsoon, the area is relatively wet and the extreme drought frequency is decreasing. (3) In summer monsoon, the abrupt change happened in 2003, while the abrupt change of winter monsoon happened in 1989, and the joint abrupt changes in different periods lead to the extreme drought frequency variation. The departure sequence vibration of annual extreme drought frequency is quasi 5 years and quasi 12 years.
大型人工湖气候效应观测研究: 以密云水库为例
DOI:10.13249/j.cnki.sgs.2017.12.018
[本文引用: 1]
应用近5 a自动气象站观测资料,分析了华北地区最大人工湖——密云水库的局地气候效应。结果表明:① 密云水库库区相比于附近平原地带具有气温偏低、湿度偏高、风速偏弱、降水量偏大等特点。水库对区域气候的影响范围约在10 km内,离水库越近的地方,受影响越大。② 密云水库的气候效应主要体现在夏半年,尤以气温和降水最为明显。③ 水库南、北两侧受到的局地环流的影响具有明显的差异,库区东西方向的年平均局地风速约为0.14 m/s,南北方向约为 0.10 m/s。下垫面属性的热力差异及特殊地形条件使得密云水库附近同时存在山谷风和湖陆风现象,其叠加效应是导致区域内不同位置间气象要素出现季节性及日变化差异的主要原因。
Observational study on climate effect of large artificial lake: Taking Miyun Reservoir as an example
There exists lake-land breeze that wind blowing onshore from lake to land during the day and offshore in the evening around lake area, due to differences in air pressure mainly caused by different heat capacities between lake and land. Generally speaking, the closer to the lake, the more remarkable the lake climate effects. For studying the lake climate effects, it is not only important for understanding the characteristics of local climate and atmospheric circulation, but also helpful for analyzing and forecasting meso-and micro-scale weather processes. Miyun Reservoir (MYR), which located at 15 km north of Miyun District of Beijing city, is the largest artificial lake in North China. Up to now, there are seldom reports on the influence of MYR on local weather and climate. Based on hourly observation data obtained by 77 automatic weather stations surrounding MYR from 2011 to 2015, local climate effects of MYR were explored and discussed in the present work. The results showed that: 1) comparing with peripheral plains, climate effects of MYR were characterized by the facts that lower air temperature, higher humidity, slightly weaker wind speed and larger rainfall. As far as regional climate was concerned, the MYR had a modulate effect on the local climate and the spatial extent of the effect is about 10 km. The closer to the MYR, the more notable the MYR climate effects. 2) The MYR climate effects were mainly occurred in the summer, especially for temperature and rainfall. In detail, averaged air temperature was lower of 0.96℃ and averaged rainfall amount was higher of 13.3% in MYR than in the adjacent plains, where has the same elevation with MYR away from 10km. In addition, there were significant differences in diurnal variations of meteorological factors between the south and north regions of the MYR. 3) Excluding the impact of the large-scale background wind field, local wind presented the characteristics of monthly variation, i.e., mountain breeze was dominant from April to September, especially in summer; while in other months, valley breeze was more prevailing, especially in the wintertime. In general, annual averaged local wind speed was about 0.14 m/s in the east-west direction, which was slightly larger than that of 0.10 m/s in the north-south direction around the MYR. 4) In summer, there existed significant differences in wind vectors at the south and north regions of the MYR, due to the influence of local circulation. In most time of the whole day, component anomalies were usually in the same phase, while component anomalies presented out of phase at the south and north regions of the MYR. Lake-land breeze and mountain-valley breeze had the same/opposite directions at the north/south regions of the MYR, and thus these correspondingly formed the overlaying/counteractive effects. Due to lake-land differences in heat capacities and topography effects, lake-land breeze and mountain-valley breeze in the areas around MYR usually existed at the same time, which mainly caused the differences in seasonal and diurnal variations of meteorological elements at different locations around the MYR region.
Local climate sensitivity of the Three Gorges Dam
安康水库蓄水前后上游气候变化特征
Characteristics of climate change in Ankang Reservoir upstream basin before and after impoundment
Analysis on the variation trend of evaporation and precipitation in Xiaolangdi Reservoir
Based on the monthly evaporation and precipitation data from 1982 to 2013 of 13 meteorological stations in and around the Xiaolangdi Reservoir, the linear tendency estimation method, cumulative anomaly, M-K mutation detection method and ARIMA model are used to study and predict the changing characteristics of evaporation and precipitation. The results show that the annual evaporation and precipitation in the reservoir area both show a downward trend. The evaporation has an abrupt decline in 2001, and the precipitation decreases suddenly in 2003 and 2011. After impoundment, the annual evaporation volume changed from the upward trend to a weak downward trend, and the downward trend of annual precipitation is weakened. The impact of impoundment on evaporation and precipitation is limited, and the impact intensity decreases with increasing distance from the reservoir. The reservoir area’s evaporation and precipitation have significant seasonal variation characteristics, and the future evaporation will show a slight downward trend, while the precipitation will show a slight upward trend.
Impact of artificial reservoir size and land use/land cover patterns on probable maximum precipitation and flood: Case of Folsom Dam on the American river
On the climate impact of the local circulation in the Itaipu Lake Area
蓄水前后三峡库区气候时空变化特征
Spatial and temporal characteristics of climate change in Three Gorges Reservoir Area before and after impoundment
Spatiotemporal variations of extreme precipitation under a changing climate in the Three Gorges Reservoir Area (TGRA)
长江三峡库区和上游气候变化特点及其影响
Climate change over the Three Gorges Reservoir and upper Yangtze with its possible effect
Three Gorges Dam affects regional precipitation
利用交叉小波技术分析三峡水库蓄排水过程对库区降雨量的影响
Cross Wavelet analysis on the influence of the Three Gorges Dam impounding on the reservoir precipitation
Accounting for temporal variability for improved precipitation regionalization based on self-organizing map coupled with information theory
三峡水库蓄水后库区气候要素变化趋势分析
Analysis on variation trend of climate factors in Three Gorges Reservoir area after impoundment
Spatial-temporal characteristics of epilithic algae succession on artificial substrata in relation to water quality in Erhai Lake, Yunnan province, China
Land use and land cover change assessment in the context of flood hazard in Lagos State, Nigeria
Incessant flooding is a major hazard in Lagos State, Nigeria, occurring concurrently with increased urbanization and urban expansion rate. Consequently, there is a need for an assessment of Land Use and Land Cover (LULC) changes over time in the context of flood hazard mapping to evaluate the possible causes of flood increment in the State. Four major land cover types (water, wetland, vegetation, and developed) were mapped and analyzed over 35 years in the study area. We introduced a map-matrix-based, post-classification LULC change detection method to estimate multi-year land cover changes between 1986 and 2000, 2000 and 2016, 2016 and 2020, and 1986 and 2020. Seven criteria were identified as potential causative factors responsible for the increasing flood hazards in the study area. Their weights were estimated using a combined (hybrid) Analytical Hierarchy Process (AHP) and Shannon Entropy weighting method. The resulting flood hazard categories were very high, high, moderate, low, and very low hazard levels. Analysis of the LULC change in the context of flood hazard suggests that most changes in LULC result in the conversion of wetland areas into developed areas and unplanned development in very high to moderate flood hazard zones. There was a 69% decrease in wetland and 94% increase in the developed area during the 35 years. While wetland was a primary land cover type in 1986, it became the least land cover type in 2020. These LULC changes could be responsible for the rise in flooding in the State.
Jensen-information generating function and its connections to some well-known information measures
An entropy-based investigation into the variability of precipitation
南海夏季风建立日期的确定和东亚夏季风强度指数的选取
Definition of South China Sea summer monsoon's onset date and East Asian summer monsoon's Index
南海西南季风多时间尺度变化及其与海温的相互作用
The multi-time scale variations of summer monsoon over South China Sea and its interaction with SST anomaly
Analysing the trend of rainfall in Asir region of Saudi Arabia using the family of Mann-Kendall tests, innovative trend analysis, and detrended fluctuation analysis
Automatic mutation feature identification from well logging curves based on sliding t test algorithm
Identification of vehicle interior noise sources based on wavelet transform and partial coherence analysis
1960-2017年艾比湖流域实际蒸散量与气象要素的变化特征
DOI:10.11821/dlxb202105010
[本文引用: 2]
传统估算蒸散发的方法大都基于局地尺度,而在生态水文发生剧烈变化的资料稀缺流域背景下,充分考虑流域下垫面的空间变异性的陆面过程模型为流域长时序、大尺度及连续模拟实际蒸散量提供了新途径。以艾比湖流域为研究区,应用可变下渗能力模型(VIC)模拟1960—2017年艾比湖流域的水文过程,探讨研究区值实际蒸散发量的年、月、日时空变化规律,并运用小波分析方法对5个气象要素及研究区实际蒸散发量的模拟值进行多尺度特征分析,结果表明:① VIC在温泉和博乐的径流纳什效率系数(NSE)分别为0.09和0.23,模拟效果较为满意;VIC实际蒸散量的模拟值与理论计算值,R<sup>2</sup>达0.80,均方根误差(RMSE)为31.76 mm a<sup>-1</sup>,NSE为0.32,模拟效果相对较好;② 时间尺度上,艾比湖流域58 a来年际实际蒸散量呈上升趋势,年均实际蒸散量以1.03 mm a<sup>-1</sup>的速率递增;月值和日值蒸散量均呈单峰趋势;且年代际变化中5—7月的实际蒸散量在20世纪90年代和21世纪呈现下降趋势,20世纪70年呈现上升趋势,而其余月份无明显变化;③ 空间分布上,艾比湖流域内实际蒸散发量总体上呈现高海拔及其附近地区蒸散强烈,从春季到夏季,强蒸散区由西北向东南转移,年实际蒸散量空间分布与春夏季分布一致;④ 艾比湖流域实际蒸散发量与各气象要素在时频域中均存在1~4个显著性周期,且在一定尺度的周期上,平均风速、平均温度以及日照时数超前于实际蒸散量变化,而年降水量和相对湿度滞后于实际蒸散量变化,受降水影响实际蒸散发1965年和2003年发生1 a周期的“强—弱”转换,受相对湿度影响实际蒸散量在1965年和2008年发生2~4.5 a周期的“强—弱”转换。
Variation characteristics of actual evapotranspiration and meteorological elements in the Ebinur Lake basin from 1960 to 2017
Predictive modelling and optimization of an airlift bioreactor for selenite removal from wastewater using artificial neural networks and particle swarm optimization
Prediction of sea surface temperature by combining interdimensional and self-attention with neural networks
Sea surface temperature (SST) is one of the most important and widely used physical parameters for oceanography and meteorology. To obtain SST, in addition to direct measurement, remote sensing, and numerical models, a variety of data-driven models have been developed with a wealth of SST data being accumulated. As oceans are comprehensive and complex dynamic systems, the distribution and variation of SST are affected by various factors. To overcome this challenge and improve the prediction accuracy, a multi-variable long short-term memory (LSTM) model is proposed which takes wind speed and air pressure at sea level together with SST as inputs. Furthermore, two attention mechanisms are introduced to optimize the model. An interdimensional attention strategy, which is similar to the positional encoding matrix, is utilized to focus on important historical moments of multi-dimensional input; a self-attention strategy is adopted to smooth the data during the training process. Forty-three-year monthly mean SST and meteorological data from the fifth-generation ECMWF (European Centre for Medium-Range Weather Forecasts) reanalysis (ERA5) are collected to train and test the model for the sea areas around China. The performance of the model is evaluated in terms of different statistical parameters, namely the coefficient of determination, root mean squared error, mean absolute error and mean average percentage error, with a range of 0.9138–0.991, 0.3928–0.8789, 0.3213–0.6803, and 0.1067–0.2336, respectively. The prediction results indicate that it is superior to the LSTM-only model and models taking SST only as input, and confirm that our model is promising for oceanography and meteorology investigation.
Prediction of mean radiant temperature distribution around a building in hot summer days using optimized multilayer neural network model
气候变化对秦岭北坡径流过程的影响机制研究: 以灞河流域为例
Influencing mechanisms of climate change on runoff process in the north slope of Qinling Mountains: A case of the Bahe River Basin
Contribution of moisture sources to precipitation changes in the Three Gorges Reservoir Region
. Precipitation changes in the Three Gorges Reservoir\nRegion (TGRR) play a critical role in the operation and regulation of the\nThree Gorges Dam (TGD) and the protection of residents and properties. The\npotential impacts of the TGD on local and regional circulation patterns,\nespecially the precipitation patterns, have received considerable attention\nsince its construction. However, how the moisture transport affects\nprecipitation changes in the TGRR spatially and temporally remains obscure.\nIn this study, we investigate the long-term moisture sources of\nprecipitation and their contributions to precipitation changes over\nthe TGRR using an atmospheric moisture tracking model. Results suggest that\nalthough there is seasonal variation, the moisture contributing to the TGRR\nprecipitation primarily originates from the areas southwest of the TGRR\ndominated by the Indian summer monsoon. In particular, the sources with the\nhighest annual moisture contribution are the southwestern part of the\nYangtze River basin and the southeastern tip of the Tibetan Plateau (TP). On average, 41 %, 56 %, and 3 % of the TGRR precipitation originates from ocean, land, and local recycling, respectively. In addition, the decreased precipitation over the TGRR during 1979–2015 is mainly attributed to the significantly decreased moisture contribution from the source regions southwest of the TGRR (especially around the southeastern tip of the TP). Compared to dry years, the higher precipitation in the TGRR during wet years is contributed by the extra moisture from the southwestern source regions that is delivered by the intensified southwesterly monsoon winds.\n
气候突变点前后无锡站年际降水序列历史演化特征
Historical evolution features of annual precipitation series at Wuxi Weather Station before and after climate mutation
Impacts of the two biggest lakes on local temperature and precipitation in the Yellow River source region of the Tibetan Plateau
Physical evolution of the Three Gorges Reservoir using advanced SVM on Landsat images and SRTM DEM data
Climate change induced precipitation and temperature effects on water resources: The case of Borkena watershed in the highlands of Wollo, central Ethiopia
三峡库区蓄水前后实际蒸散发时空变化及其与气象因子关系分析
Temporal and spatial changes of atual evapotranspiration and its relationship with meteorological factors in the Three Goreges Reservoir Area
基于WRF模式的三峡地区局地下垫面效应的数值试验
基于WRF模式, 在模式下垫面中嵌入长江水体以及改变地形高度, 研究了三峡地区长江水体和局地地形在有降水和无降水事件中的局地效应\.结果表明, 在有降水事件中, 水体下垫面为降水提供了局地水汽, 同时在局地喇叭口和峡谷地形动力强迫作用下, 近地面河谷风增加, 偏南气流携带水汽北上, 三峡地区下游段在峡谷地形的“狭管”效应作用下, 河谷风偏东风增加, 增加水汽向西输送并与偏南风北上水汽在喇叭口地形末端汇合, 下垫面变化的同时也为降水提供了充分的潜热能量, 夹带水汽气流在局地地形的强迫抬升作用下, 促使水汽辐合上升, 与高空的干冷空气造成了层结不稳定, 潜热不稳定能量的释放, 导致了该地区的降水量增加; 在无降水事件中, 长江水体在白天(夜晚)具有相应的降温(保温)作用, 进而呈现出冷(暖)湖效应, 在水体下垫面和地形作用下, 潜热在喇叭口末端聚集, 没有地形对气流阻挡作用, 偏南气流、 偏东气流加强; 在有\, 无降水事件中, 环流特征变化表明局地水体下垫面和局地地形对三峡地区天气均有不可忽视的重要性。
Numerical experimentation of local underlying surface effet based on WRF model in Three Gorges Area
Understanding the impact of dam-triggered land use/land cover change on the modification of extreme precipitation
近30余年来盛夏东亚东南季风和西南季风频率的年代际变化及其与青藏高原积雪的关系
Interdecadal variations of summer southeat and southwest monsoon frequency over East Asia and its relationship with snow cover over the Tibetan Plateau for recent 30 years
