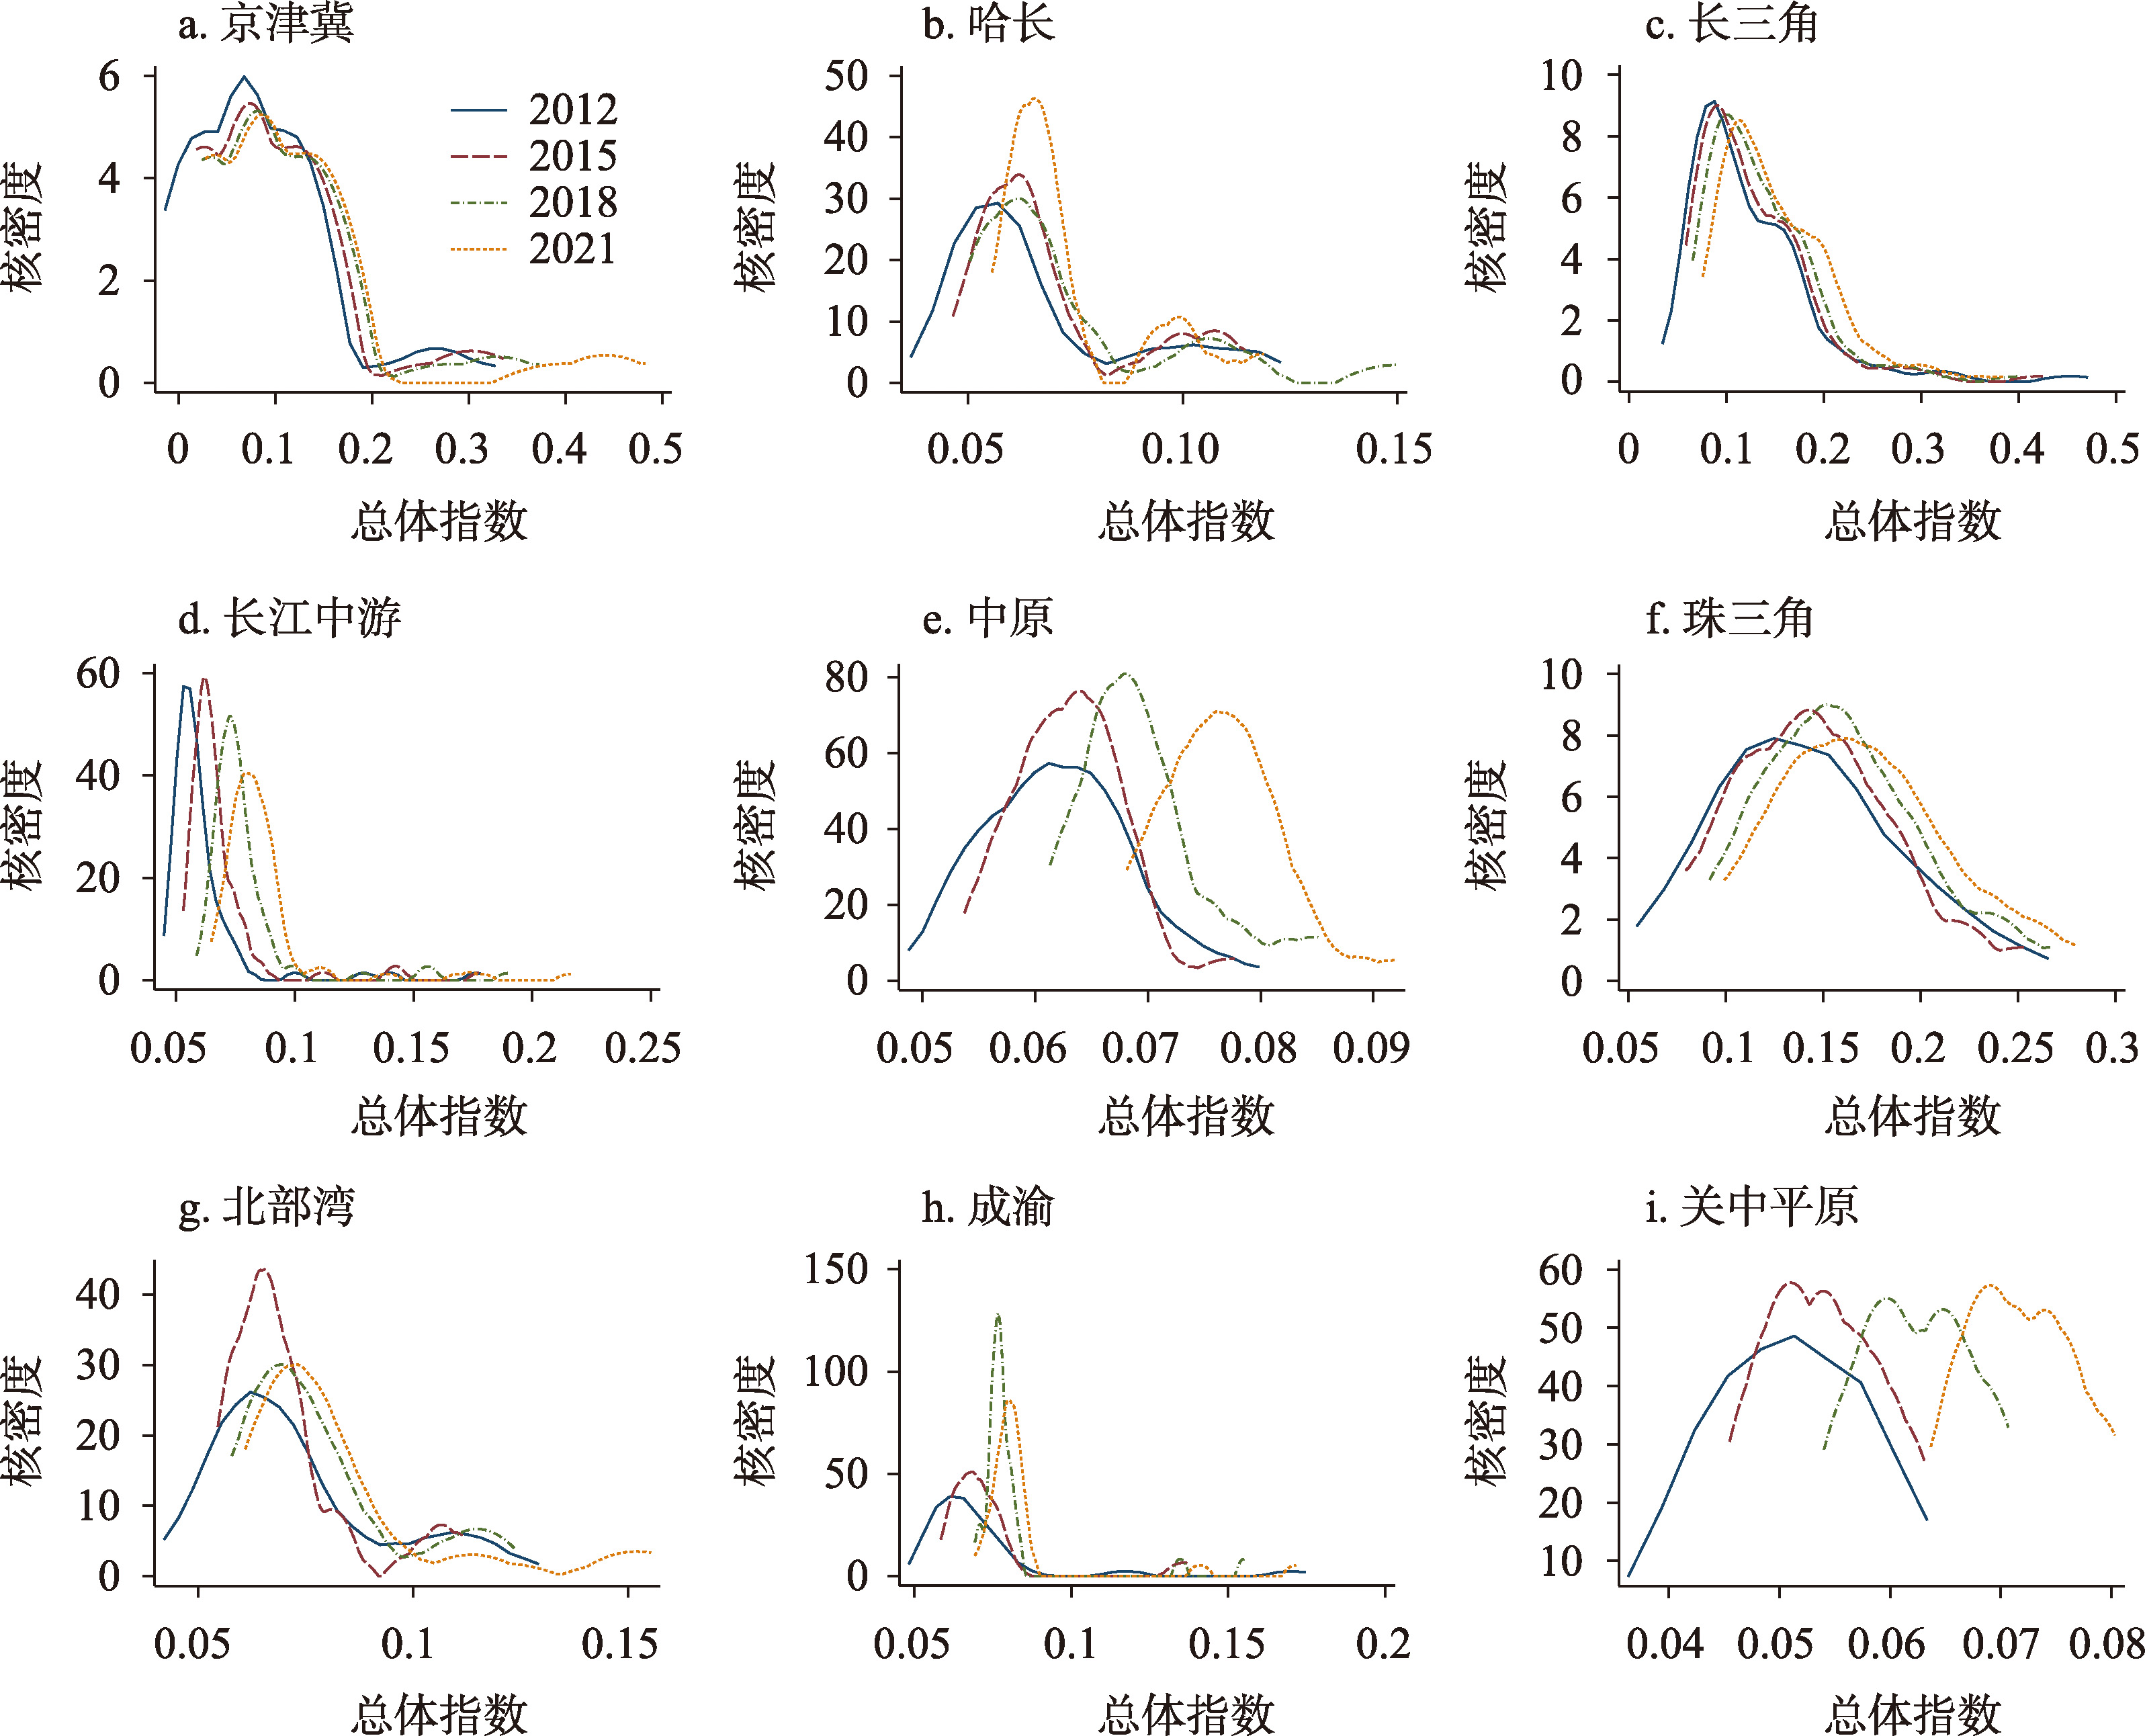
| 年份 | 京津冀 | 哈长 | 长三角 | 长江中游 | 中原 | 珠三角 | 北部湾 | 成渝 | 关中平原 |
|---|---|---|---|---|---|---|---|---|---|
| 2011 | 0.399 | 0.184 | 0.258 | 0.122 | 0.060 | 0.180 | 0.146 | 0.112 | 0.074 |
| 2012 | 0.408 | 0.165 | 0.249 | 0.117 | 0.055 | 0.174 | 0.143 | 0.125 | 0.068 |
| 2013 | 0.417 | 0.159 | 0.244 | 0.112 | 0.056 | 0.165 | 0.130 | 0.087 | 0.067 |
| 2014 | 0.411 | 0.155 | 0.235 | 0.105 | 0.050 | 0.165 | 0.131 | 0.100 | 0.067 |
| 2015 | 0.415 | 0.147 | 0.231 | 0.105 | 0.043 | 0.168 | 0.103 | 0.096 | 0.057 |
| 2016 | 0.417 | 0.141 | 0.228 | 0.101 | 0.043 | 0.167 | 0.109 | 0.088 | 0.055 |
| 2017 | 0.418 | 0.135 | 0.218 | 0.099 | 0.043 | 0.163 | 0.117 | 0.079 | 0.050 |
| 2018 | 0.398 | 0.169 | 0.211 | 0.099 | 0.045 | 0.154 | 0.118 | 0.072 | 0.050 |
| 2019 | 0.395 | 0.165 | 0.206 | 0.101 | 0.038 | 0.146 | 0.119 | 0.073 | 0.050 |
| 2020 | 0.389 | 0.149 | 0.199 | 0.098 | 0.038 | 0.139 | 0.117 | 0.074 | 0.042 |
| 2021 | 0.421 | 0.119 | 0.197 | 0.103 | 0.039 | 0.153 | 0.135 | 0.080 | 0.043 |