×
模态框(Modal)标题
在这里添加一些文本
Close
Close
Submit
Cancel
Confirm
×
模态框(Modal)标题
×
Journal
Article
Figure
Search
EN
中文
Home
About Journal
About Journal
Indexed in
Awards
Editorial Board
Guide for Authors
Browse
Current Issue
Online First
Archive
Highlights
Topic
Archive by Subject
Most Viewed
Most Download
Most Cited
E-mail Alert
RSS
Policies and Ethics
Subscribe
Contact us
EN
中文
Figure/Table detail
The balance of urban agglomeration development under the perspective of common prosperity: Theoretical connotation, indicator system and evolution characteristics
LUO Fuzheng, LI Xianle
GEOGRAPHICAL RESEARCH
, 2024, 43(
12
): 3110-3136. DOI:
10.11821/dlyj020240468
Ⅰ
Ⅱ
Ⅲ
Ⅳ
Ⅰ
0.815
0.183
0.002
0.000
Ⅱ
0.024
0.801
0.175
0.000
Ⅲ
0.001
0.041
0.896
0.062
Ⅳ
0.000
0.000
0.009
0.991
Tab. 15
The Markov chain transition probability matrix of the overall index
Other figure/table from this article
Tab. 1
Indicator system for the balanced development of urban agglomerations
Tab. 2
Cities and approval dates for urban agglomerations
Tab. 3
Annual mean index values for nine major urban agglomerations
Tab. 4
Annual mean index values for urban agglomerations
Tab. 5
Mean values of various dimensions for selected years by urban agglomerations
Tab. 6
Mean index values and annual growth rates by urban agglomeration
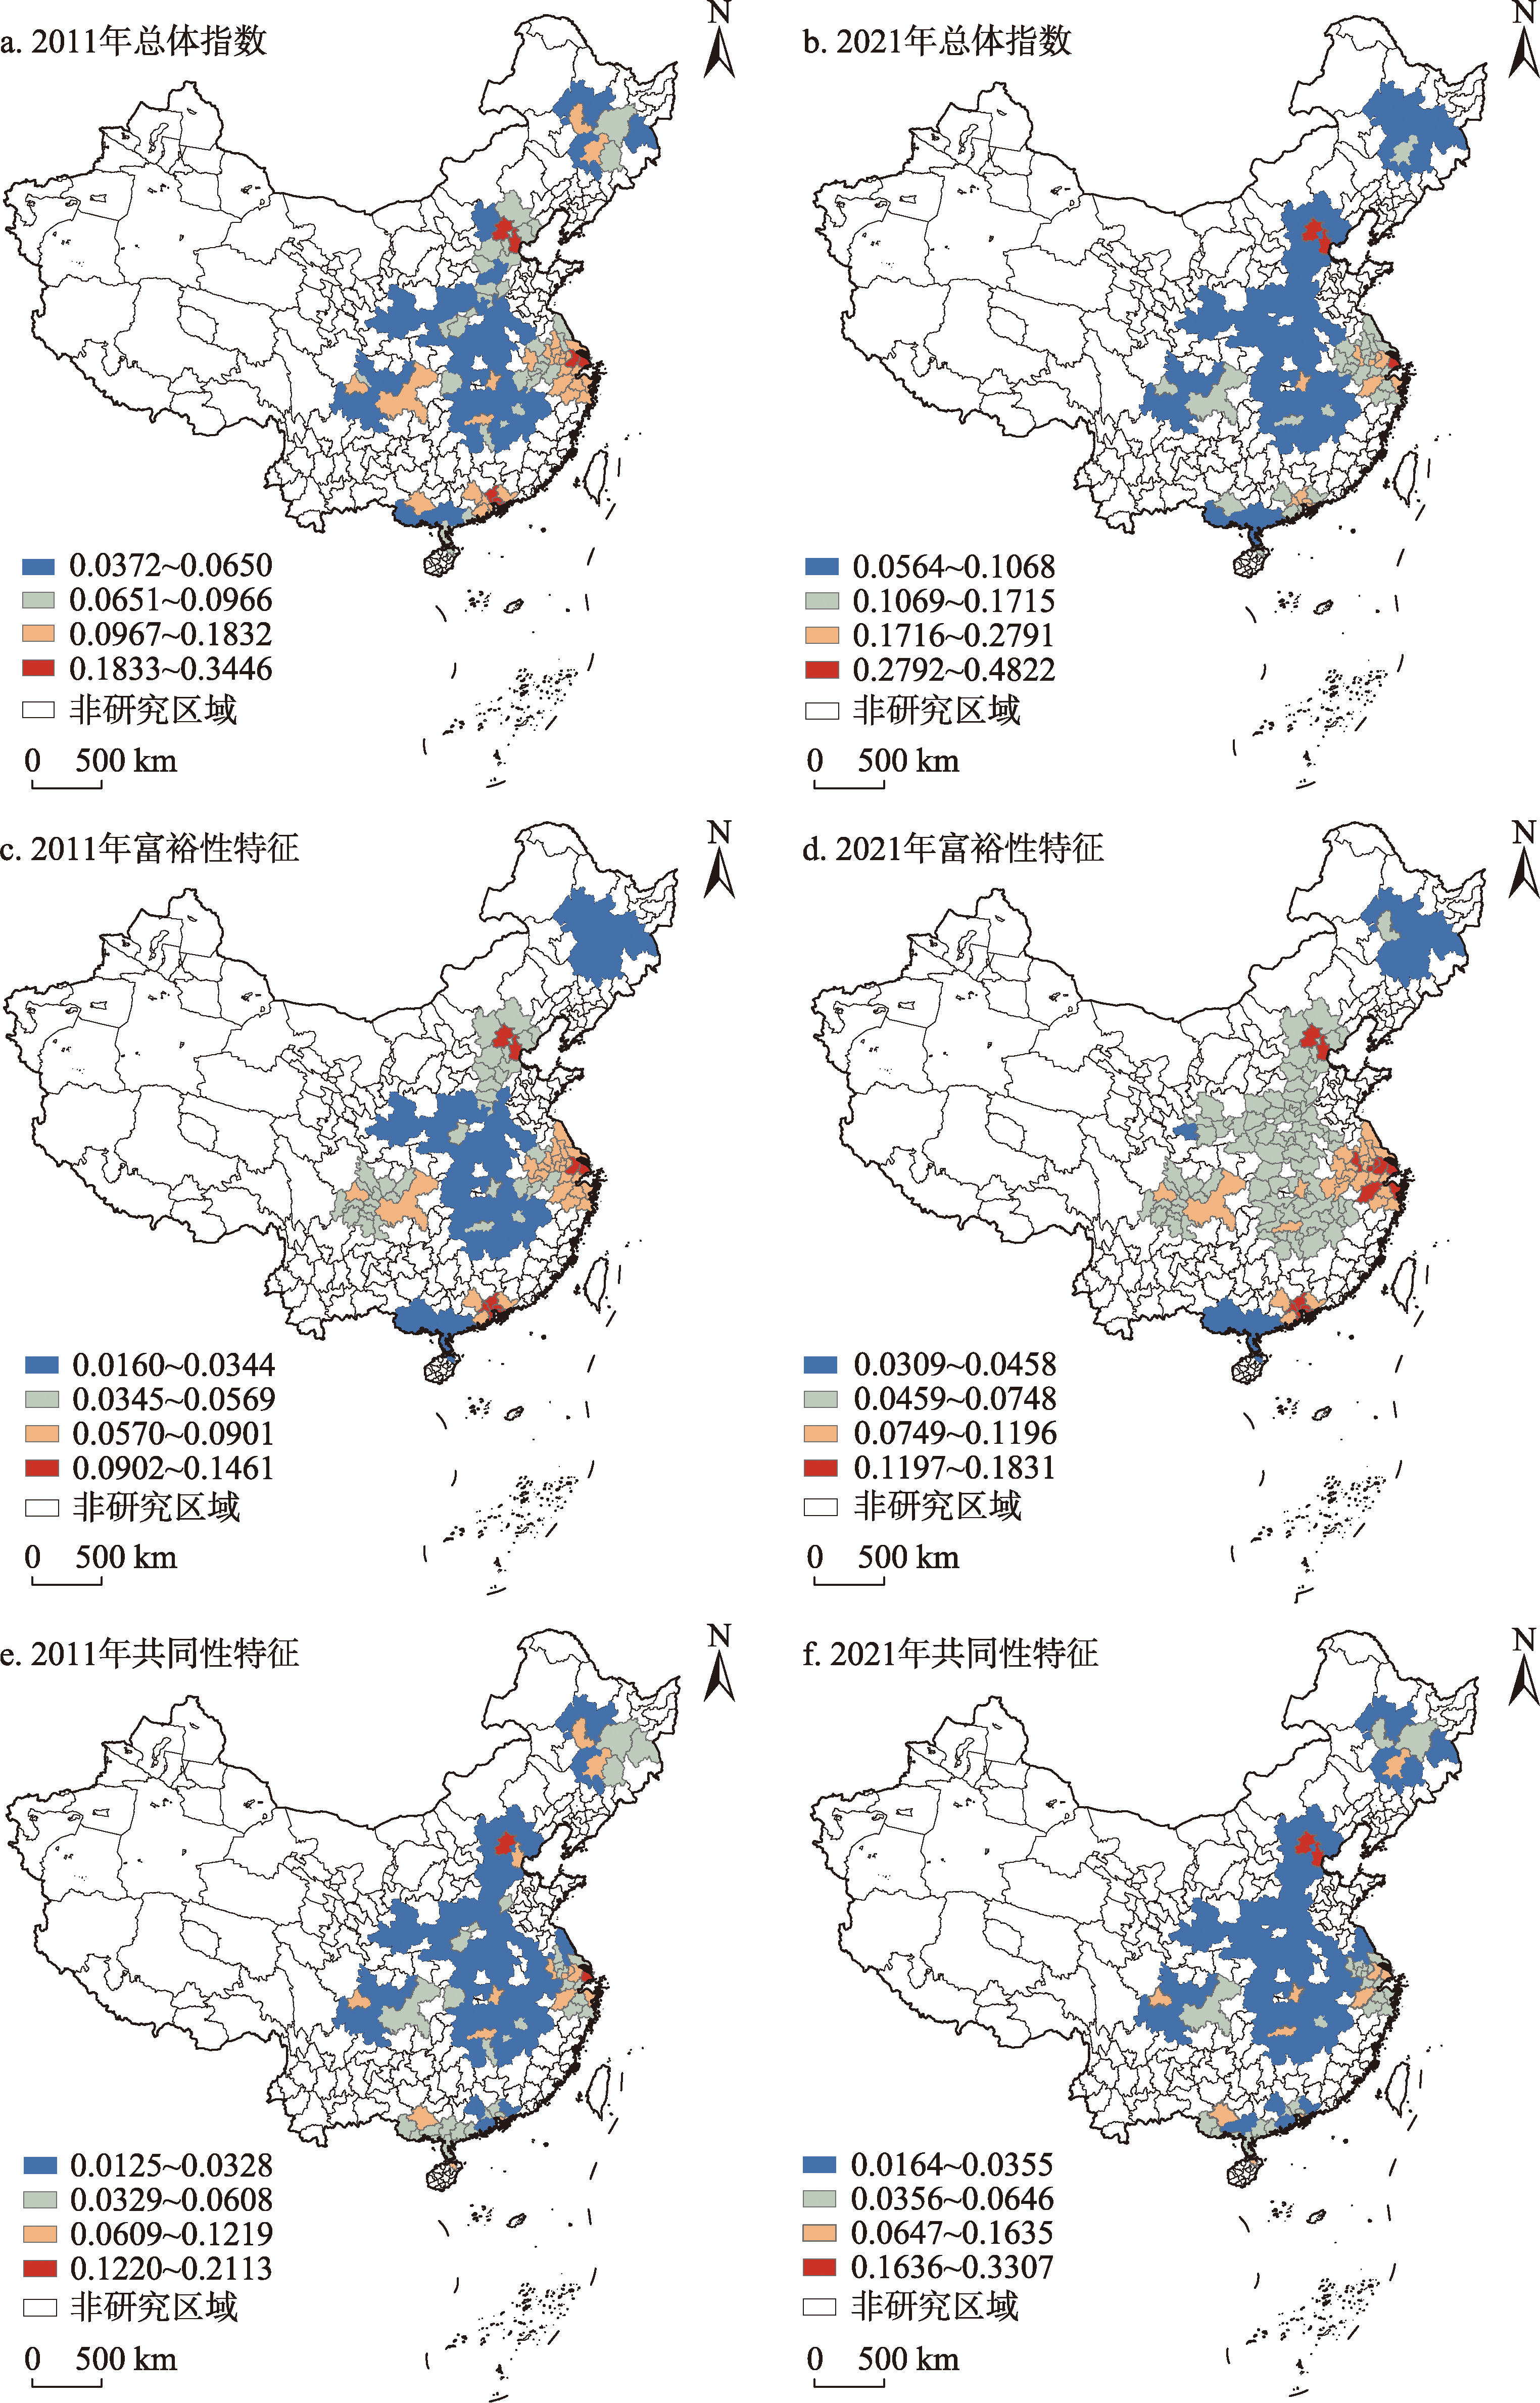
Fig. 1
Spatiotemporal distribution patterns of overall index, affluence characteristics, and commonality characteristics in 2011 and 2021
Tab. 7
Gini coefficient of the overall index and decomposition results
Tab. 8
The Gini coefficient of the overall index of urban agglomerations
Tab. 9
Overall index and dimension-specific
σ
convergence results
Tab. 10
Absolute
β
convergence of sub-indices
Tab. 11
Absolute
β
convergence of urban agglomerations
Tab. 12
Conditional
β
convergence of sub-indices
Tab. 13
Conditional
β
convergence of urban agglomerations
Tab. 14
Correlation coefficient
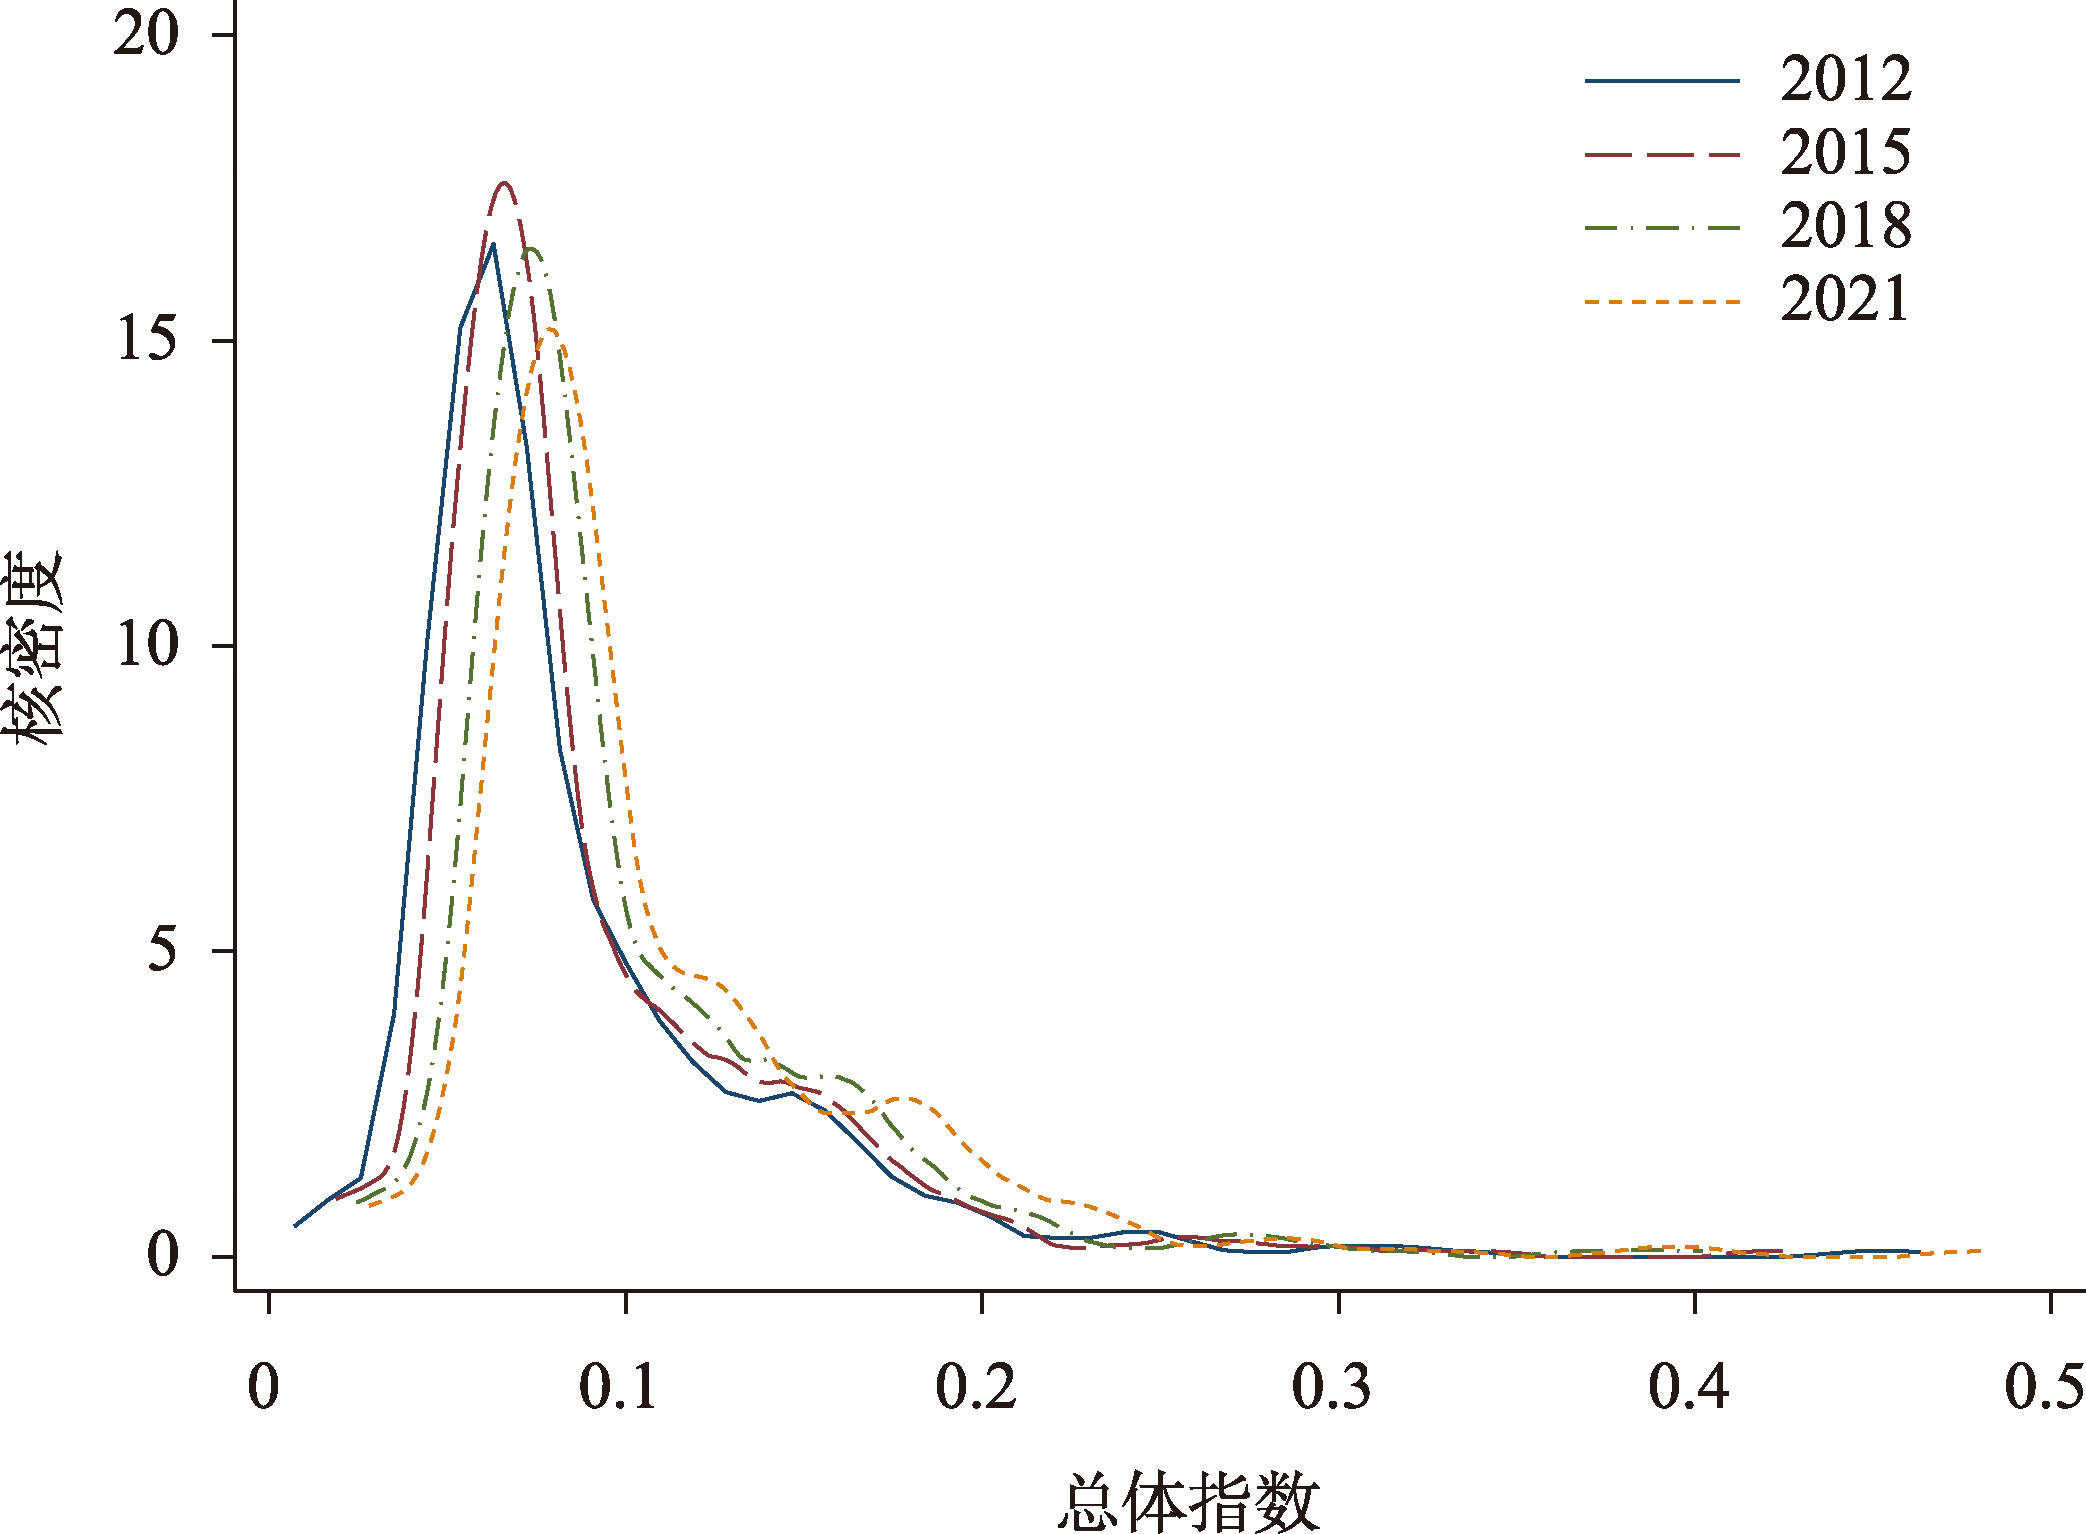
Fig. 2
Kernel density curves of the overall index of the nine major urban agglomerations
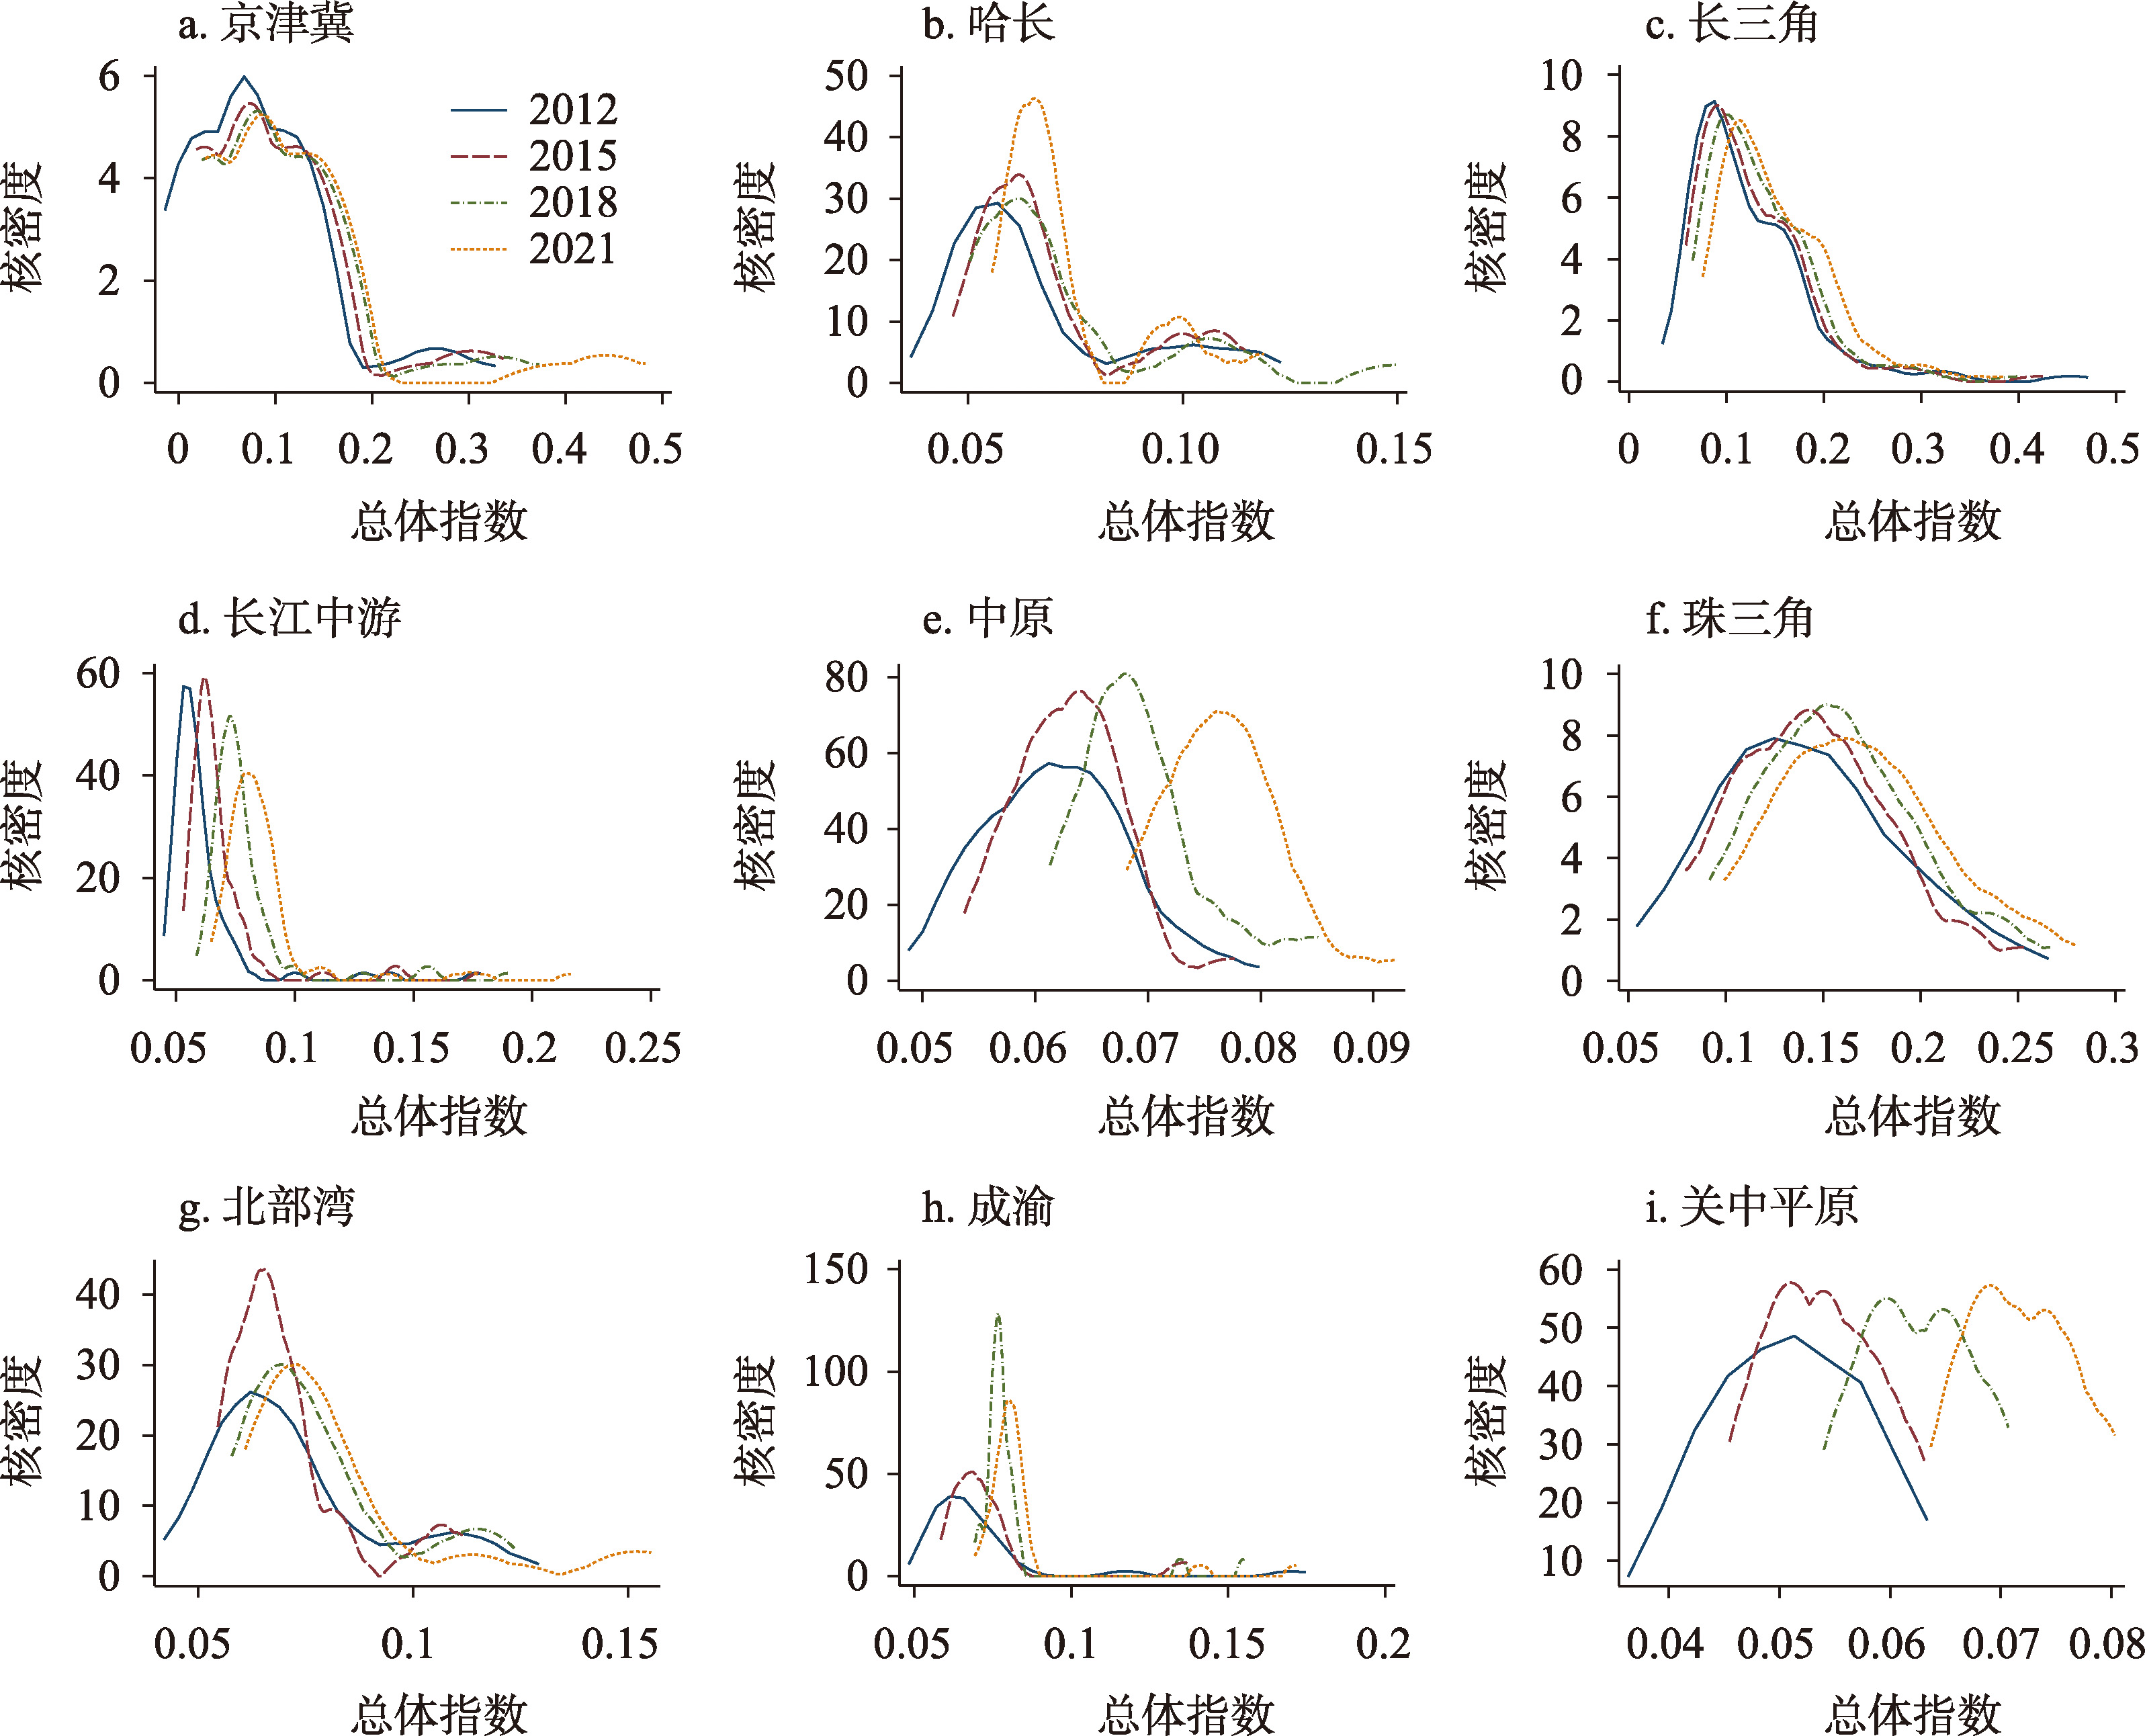
Fig. 3
The overall index kernel density of each urban agglomeration